

Much like weight loss or finding more time to read, including financial planning in your resolutions for 2024 is a great idea. It is an election year in the United States, which means we will see a lot of promises. If history is an indicator, there will be a positive return for the S&P. Twenty-four presidential elections yielded gains in all but four years since 1928. This could be luck, or perhaps the market does well when politicians feel the most motivation to prove they are worthy of a vote or are distracted with campaigning. As humans, we often try to ‘make sense’ of the price action and behavior of the stock market, and in this endeavor, we often hurt ourselves more than help. We cover a few common mistakes investors make that we can guard against below. It is important to look at where we have been to get clues as to where we are headed.
Factors Influencing 2023 Market Resilience
Despite widespread expectations of a recession in 2023, the US stock markets proved resilient. The Nasdaq led the way, with the artificial intelligence (AI) revolution seemingly upon us, driving a gain of 53.81%. Nvidia produced an incredible 239% gain, while Facebook (Meta Platforms), Uber, and Tesla experienced over 100% gains. This also led to solid performance for the S&P, up by 24%. The appreciation put both slightly above their 2021 close and offset the 2022 loss. The 10-Year Treasury Bill also increased but remains far below its 2020 apex. As did commodities, the SocGen CTA index declined after a strong previous year. Inflation steadied, and the Russian-Ukraine war entered a stalemate in its second year. Gold and REITs were both positive.
| S&P 500 | NASDAQ | 10-Year Treasury | SocGen CTA Index | Gold | REITs | Commodities | ||
| 2020 | 16.26% | 47.58% | 10.01% | 3.18% | 24.43% | -8.10% | -23.94% | |
| 2021 | 26.89% | 26.63% | -3.33% | 6.16% | -3.51% | 32.50% | 38.77% | |
| 2022 | -19.44% | -32.97% | -15.19% | 20.17% | -0.23% | -23.60% | 24.08% | |
| 2023 | 24.23% | 53.81% | 3.64% | -3.50% | 13.08% | 11.50% | -5.51% |
Patterns and Trends
When examining annual returns, I like to identify patterns. Often, it is difficult to see them as they play out. In hindsight, the equity markets found their footing in June of 2022, with the belief that the Fed would continue its rate hike campaign to calm inflation priced in. The higher rates and balance sheet reduction did not lead to calamity, as many predicted. The initial shock of a European war also settled, reducing the risk of further contagion to the system. Volatility declined. Movement is the lifeblood of CTAs, so the slowdown resulted in poor results for them and the commodity markets. Debt continues to be a question as developed economies spent heavily throughout the pandemic. That bill is now coming due, impacting currency movement and gold more than we have seen in some time.
Challenges and Questions for 2024
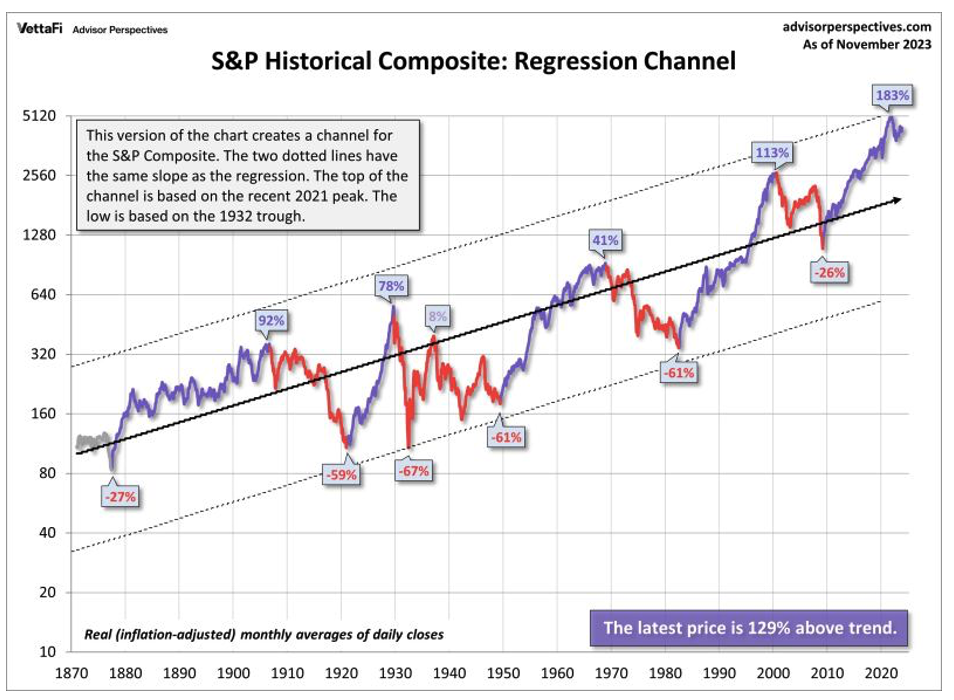
A few other things stand out from the chart figures. The correlation between bonds and equities appears to be increasing. The 60/40 portfolio that worked for so long has not been effective recently. In the stock market, the breadth of returns is quite poor, with many large firms dominating the indices while others tread water. VettaFi says the S&P is running 129% above its expected trend line. A truly diversified portfolio should have portions that perform poorly when others do well. It goes against our nature to add diversification when things are working and commodities and futures traders seem to be the ones that zig when others zag. This makes them easy to dislike since they often lose when ‘everything’ else is winning, but increasingly, they provide one of the few sources of true non-correlation. I prefer to think of this as a feature and not a bug. Recognizing that this is difficult for some investors to watch, some managers are adding long equity components to their strategies to soften this phenomenon. Knowing your own biases and actively managing them is key to being an investor.
Investor Mistakes and Dalbar’s Insights
Dalbar, a leading market research firm, compiled a list of common investor mistakes that address these predispositions. While many of us know what we should be doing with our investments, resisting our natural inclinations is difficult, to say the least. This applies even to investment professionals. In my experience, people tend to add to winning positions, cut losing allocations, and close portfolios at what ends up being the worst timing. Alternative investments charge incentive fees, which do not get charged during down periods. Thus, if a customer closes during a drawdown, they can potentially miss out on growth aided by lower fees. Studies show that across asset classes, investors consistently underperform their indices.
The key issues are a lack of capital to invest and psychology. Dalbar defined nine of the irrational investment behavior biases specifically:
- Loss Aversion – The fear of loss leads to a withdrawal of capital at the worst possible time. Also known as “panic selling.”
- Narrow Framing – Making decisions about one part of the portfolio without considering the effects on the total.
- Anchoring – The process of remaining focused on what happened previously and not adapting to a changing market.
- Mental Accounting – Separating the performance of investments mentally to justify success and failure.
- Lack of Diversification – Believing a portfolio is diversified when it is a highly correlated pool of assets.
- Herding– Following what everyone else is doing. Which leads to “buy high/sell low.”
- Regret – Not performing a necessary action due to the regret of a previous failure.
- Media Response – The media is biased toward optimism to sell products from advertisers and attract views/readership.
- Optimism – Overly optimistic assumptions lead to rather dramatic reversions when met with reality.
Aligning Thought Process with Psychology
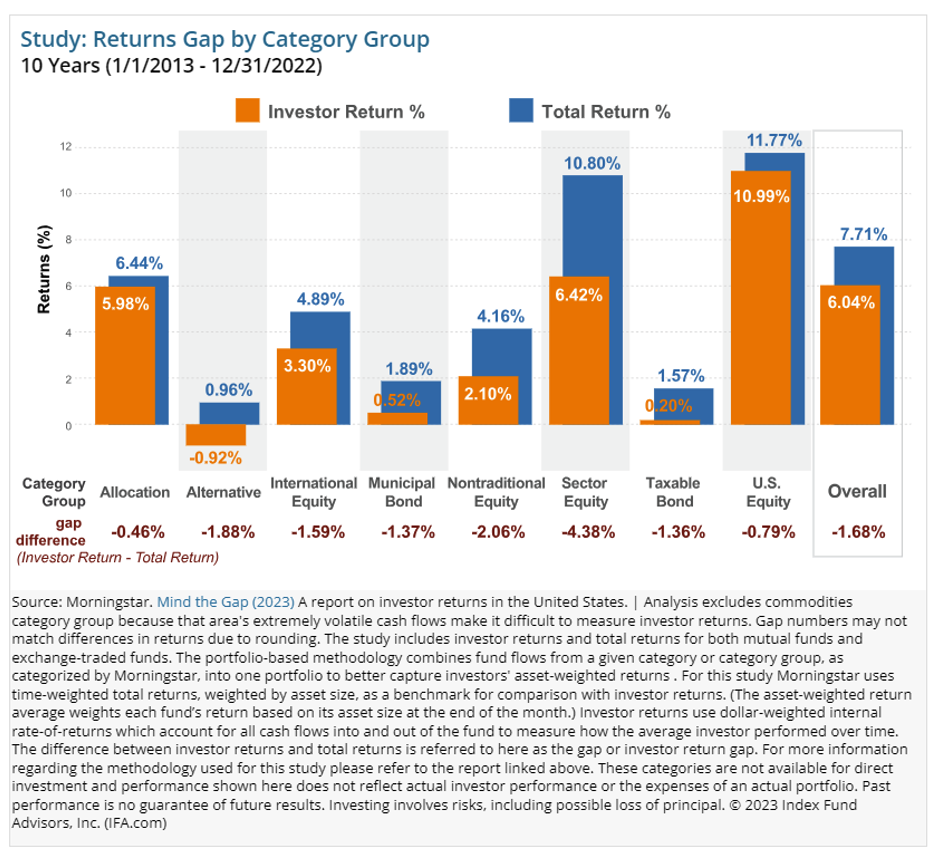
The chart below illustrates how this behavior plays out. It’s worth noting that many ETFs and mutual funds consistently underperform their index because the headline rate does not include trading costs or fees. Therefore, it is crucial to align your thought process with your psychology and recognize that ‘beating the S&P’ is even harder than it looks. While the Fed attempts to engineer a ‘soft landing,’ it’s important to understand that eliminating risk is very challenging. A steady portfolio with a mix of winning and losing positions often outperforms in the long run. The last two years demonstrate this: the S&P lost 19.44% in 2022, which requires a 24.13% return just to recover to even. Reducing the magnitude of losing periods is often the key to long-term success.
Good advisors do not attempt to predict the market. Instead, they prepare for the best and worst-case scenarios from the onset of the customer relationship. Investors can help by asking themselves if decisions made with clarity at the beginning still make sense or if they are influenced by psychological factors that impact all of us. Every year comes with different surprises. I can’t wait to see what they will be in 2024. Best of luck to all of you in reaching your goals this year.