Weiqin Dong, CFA, Buckingham Global Advisors, LLC
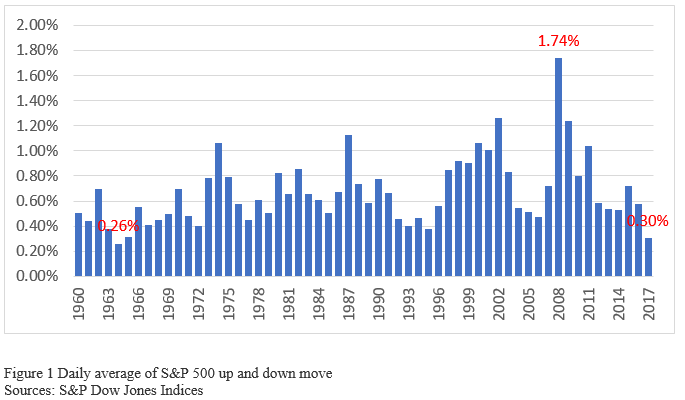
2017 will go down as one of the most remarkable years for the US Stock market on record. The Dow Jones closed with 71 record highs which is a record in itself. The Dow posted a record high almost every three days. The S&P 500 posted gains of 19.4% with near-record low volatility while enduring geopolitical tensions, massive natural disasters, political turmoil in Washington and a tightening of monetary policy. In fact, the market currently has the calmest price fluctuation in 50 years, with the S&P 500’s average (daily up-or-down moves) a mere 0.30%. As a comparison, this is over half the move last year and almost a sixth (1/6) of the average daily move in 2008. It’s the smallest absolute daily move average since 1965; we had to trace back to 1964 when S&P 500 average daily move went below 0.3%. (Figure 1).
Since we published our Q3 bullish market report (link:yicai.com), the S&P 500 has lived up to the 4th quarter’s strong seasonality and returned 6% to prove that our bullish call was correct. All the drivers we mentioned in the report are still intact as we enter 2018:
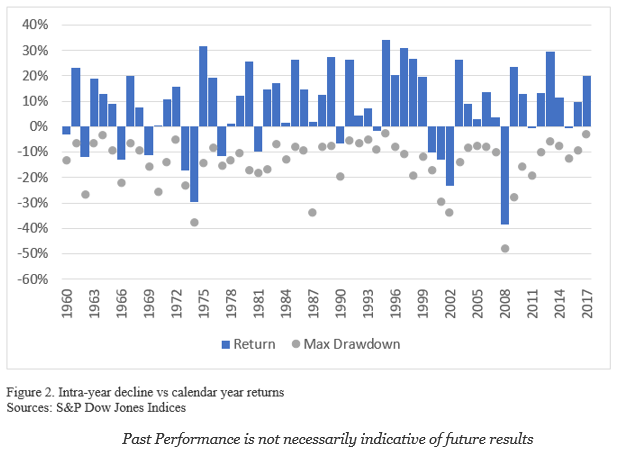
- In our opinion, The US Stock Market is firmly in an uptrend. Nearly 75% of US stocks are above their 200-day moving averages, 79% of the sub-industries are in an uptrend and the S&P 500’s 200 day moving average has been trending upward since June 2016. Not only is the US market in an uptrend, it has done so with extremely low volatility — for the entire year of 2017. The S&P 500’s maximum drawdown was less than 3%, which is lowest since 1995 and second lowest in 60 years (Figure 2). In fact, the S&P 500 has not experienced a 3% correction since November 2016, the longest stretch on record. The CBOE Volatility Index, aka, “the fear index” stayed around 10 for most of year with an average of 11, nearly half of the historical average. International markets are also strong this year, with almost 70% of 47 major stock markets above 50 days moving average. All this momentum will carry the market into 2018.
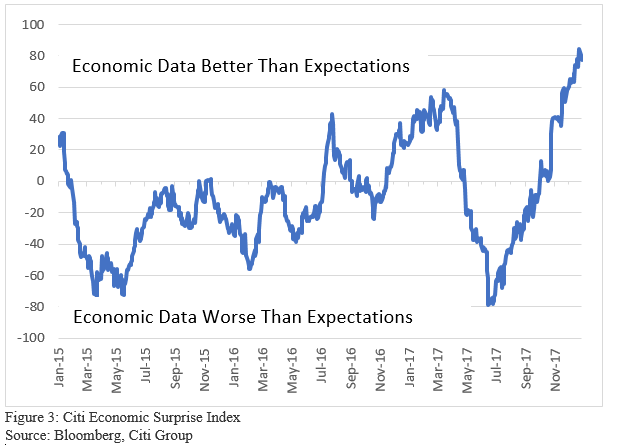
- US economy has ended the year on a high note. The Citi Economic Surprise Index, a widely followed indicator of how the data is matching up to expectations, has turned very positive after staying much of Q2 and Q3 in negative territory (Figure 3). The New York Fed’s recession model shows the probability of US recession in 11/2018 is about 11%, up from 10% 3 month ago. It is still low enough not to be a concern.
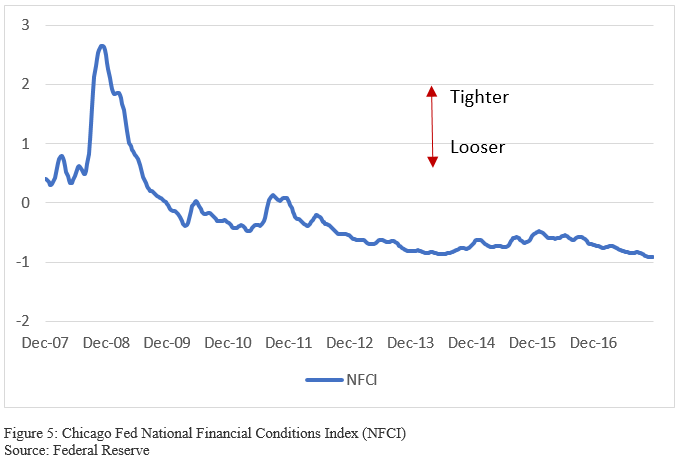
The Federal Reserve Bank of Atlanta’s GDPNow model forecasted for real GDP growth (seasonally adjusted annual rate) in the fourth quarter of 2017 is 2.8% on December 22. Business and consumer confidence is booming, both the manufacturing and services Institute for Supply Management’s indexes show robust growth, and the Index of Leading Economic Indicators continues to rise. Housing has also picking up again, with housing starts rising nearly 14% last month (Census Bureau), US existing home sales climbed to the highest level in a decade and at the same time the inventory of homes for sale (measured in months of supply) hit an all-time low (National Association of Realtors). The Underlying trend in GDP growth remains solid reflecting support from strong business and consumer confidence. In addition, continued gains in employment and income, increase in wealth and favorable financial conditions as shown below and improving global growth with projection of 4.0% from Goldman Sachs. For the first time since 2010, the world economy joined the expansion and is outperforming most predictions, the strength in the global growth is broad-based across most advanced and emerging economies.
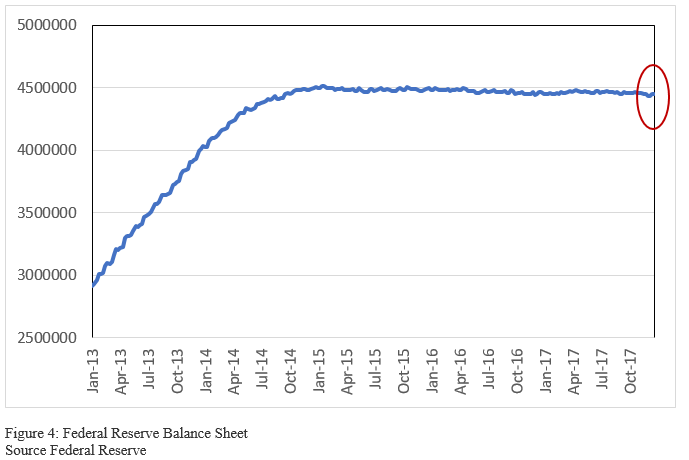
- Even though the Federal Reserve has started balance sheet normalization in October, the impact has been minimal (Figure 3, the red circle part indicating normalization): the balance sheet was $4.455 Trillion on 9/27/2017 and $4.447 Trillion on 12/20/2017, a mere reduction of 0.2%! The Financial condition measured by the NFCI (Chicago Fed National Financial Conditions Index) shows the monetary policy is looser than prior to the normalization (Figure 4) and loosest in years.
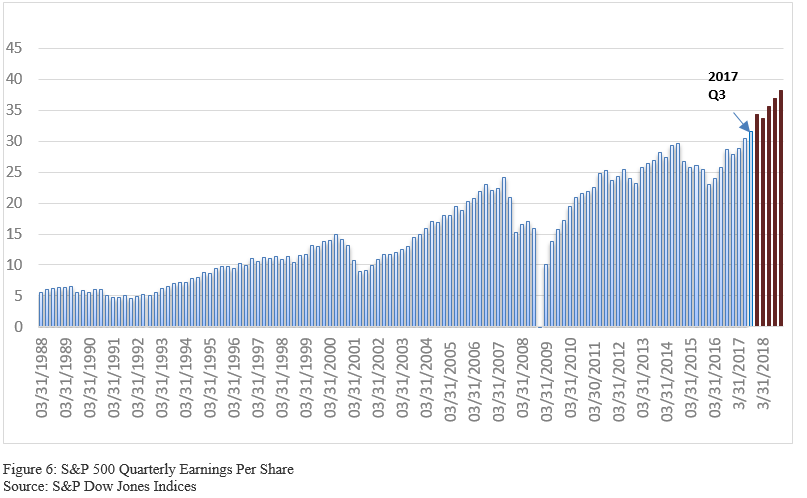
4. Earnings momentum is still very strong. For Q3 2017, after all companies reported, the earnings for S&P 500 were $31.50, a record high with the previous record high at $30.50 coming from Q2 2017 (Figure 6). For Q4 2017, the estimated earning growth rate for the S&P 500 is 10.6%, all 11 sectors are expected to report earning growth for the quarter, led by Energy sector. However, the growth rate was revised down from 11.3% on 9/30/2017, due to downward revisions to earnings estimates, led by the Industrials sector.
5. After a slight slowdown in Q2 2017, US companies picked up share buybacks in Q3 2017 (latest available data). With the lower tax rate and repatriated money from oversea after the new tax reform passed at the end of 2017, US companies would likely use the additional cash to buy back shares, pay dividend and acquire companies and the available shares and companies to the public would continue to shrink. The fall in the number of listed companies has major consequences from an investor’s point of view. Investors have less access to companies that are owned by private equity firms or that remain private. The more limited supply and higher profitability could be additional drivers of the stock market’s advancement.
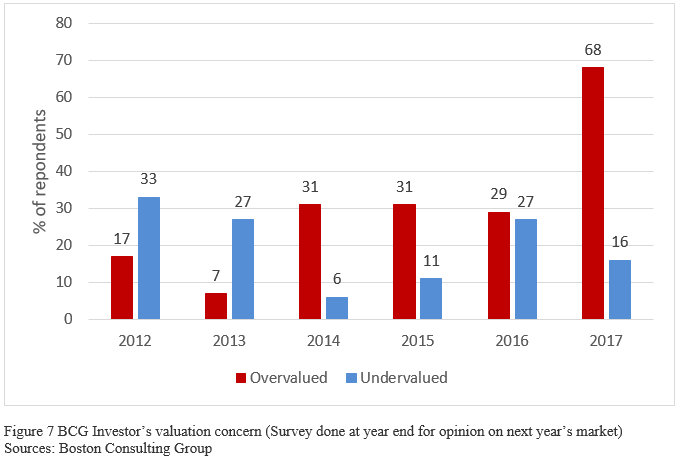
Even with the Dow Jones Industrial Average Index making more than 70 records in 2017, the smart money is more bearish than ever. According to Boston Consulting Group’s annual investor survey with 250 investors who oversee approximately $500 billion in assets, the bearish investment sentiment this year toward both equity markets and the macroeconomic environment is at its highest level since 2009. Nearly half of the survey respondents (46%) are pessimistic about equity markets for the next year, a substantial jump from 32% at year end of 2016 and 19% at year end of 2015. Overall, 68% of respondents think the market is overvalued entering 2018, this is more than twice the 29% of investors in last year end’s survey who thought the market was overvalued entering 2017(Figure 7). Among self-described bears in the 2017 survey, 79% cited market overvaluation as the reason for their pessimism.
Is all the pessimism warranted? Let’s look at some of the primary risks that stock market is facing: valuation, uncertainties from Federal Reserve, geopolitical tensions and of course, black swans. Geopolitical tensions cannot be predicted by economic models, so we will not go further on it.
Valuation:
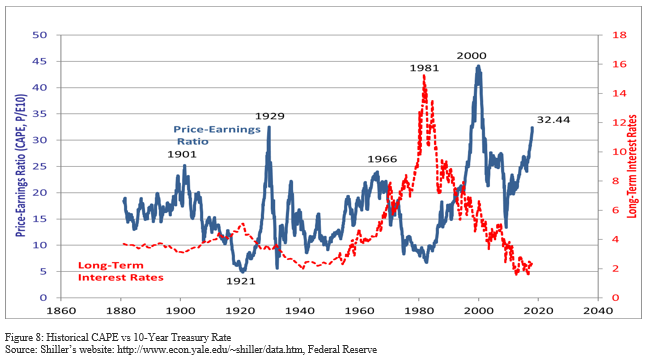
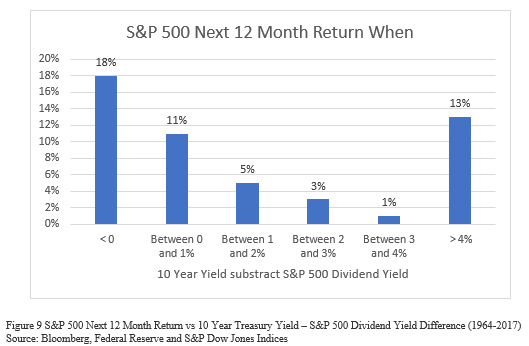
- Absolute Valuation vs Relative Valuation: The market does indeed look extremely overvalued based on almost all of the absolute valuation metrics such as Price to GAAP Earnings, Price to Shiller Earnings (CAPE), Price to Forward Earnings and etc. As shown in Figure 8, CAPE reading at 32.44 is only lower than the tech bubble (43.77) and is the same as just before great depression (32.56). Both the “Tech Bubble” and “Great Depression” were followed by major bear stock markets. But with no recession in the near future, the year 1929 is not likely to repeat in 2018. As for 2000, the long-term interest rate was around 6% comparing to over 2% today. In fact, the US stock market is moderately undervalued if comparing to the 10-year treasury yield. The difference between various yields such as trailing P/E, forward P/E, dividend yield (Figure 9) and the 10-year treasury yield show a moderately undervalued stock market. Historically, the market returned around 11% in the next 12 months when S&P 500 dividend yield (1.9%) which is less than 1% lower than 10-year yield (2.4%). While valuation is a good long-term return predictor, as we mentioned in our Q3 report, it has absolute no prediction value for next quarter’s stock market return. With P/E at this level, next quarter’s return could range from -20% to +20%. High valuation does make the market more vulnerable to the external shocks since high valuation will usually go back to normal (eventually), which is part of the reason we think the market will have increased volatility in 2018.
- Earnings momentum: Another factor could make valuation even worse is the slowdown of earnings growth momentum. The S&P 500 bottom-up operating profits are projected to be up 18% this year to finish the year at $125 and 15% next year to finish $144, both of which are record high earnings for the S&P 500.
How likely are we going to see that number in a year? A recent FactSet research looked into the last 20 years (1997-2016), the average difference between the bottom-up EPS estimate at the beginning of the year (December 31 of the previous year) and the final EPS number for that same year has been 8.6% (Figure 10). In other words, industry analysts on average have overestimated the final EPS number by 8.6% one year in advance, including three years there were substantial difference: 2001 (+36%, not shown), 2008(+43%) and 2009 (+28%). All these three years are associated with US economic recessions, we do not believe the earning for 2018 is over-estimated that much with solid economic growth, firmer commodity prices and improving credit conditions should benefit earnings. As long as those conditions remain in place, earnings growth should not collapse. Tax cuts could add 7-10% to S&P 500 earnings growth next year, but uncertainties remain. On 12/29/2017, Goldman Sachs announced a $5 billions one-time earnings write off and the stock (GS) dropped and dragged the market into a negative close on the last day of year. The earnings growth rebound in 2017 has been due mostly to a bounce in oil prices and other sectors profit growth has stalled since mid-year. While profits will likely to continue, we do believe the chance to disappoint is high in the 2018 and one of main concerns for an overvalued market. Two major concerns about profits are the potential for higher wages/inflation and interest rates. Despite explosive growth in debt, the interest rate costs have barely risen in the last 10 years, but this could change if the Federal Reserve has to increase interest rates faster than expected due to higher inflation. The Interest expense has already risen from around $18/share to $22/share for the S&P 500 due to the interest rate increase.
Uncertainties at Federal Reserve
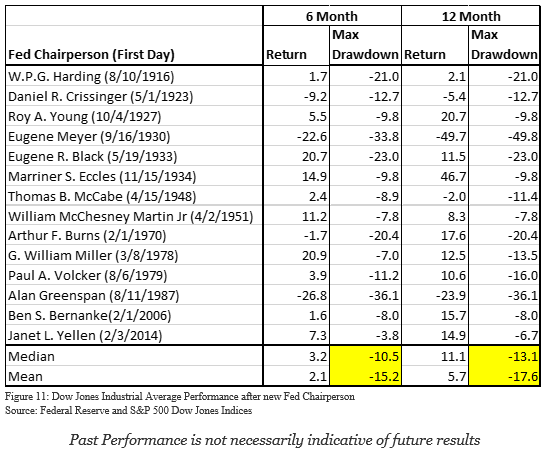
- Personnel Uncertainties: The Federal Reserve faces most of its uncertainties in recent years, with Mr. Jay Powell replacing Janet Yellen when her term expiring on 1/31/2018. There are more uncertainties with other Fed personnel. Currently, there are three empty governor seats to be filled. Three doves – Charles Evans from Chicago, Neel Kashkari from Minneapolis and Robert Kaplan from Dallas – will lose their votes in January, to be replaced by more hawkish voices. A forth dove, Mr. Dudley, plans to retire in 2018. Mr. Powell’s new colleagues may test their commitments to continuing Ms. Yellen’s approach. Historically, with a new chairperson at the Federal Reserve, the stock market had been mixed with subpar returns and an average drawdown of 15.2% within the first 6 months and 17.6% within the first 12 months. Yellen bucked the trend with the smallest drawdown of 3.8% during the first 6 months and 6.7% within the first year because she was believed to continue Mr. Ben Bernanke’s dovish approach (Figure 11). It remains to be seen how Mr. Powell will govern the Fed at a time when the risks of a policy error are increasing, and the impact of the tax cuts are uncertain.
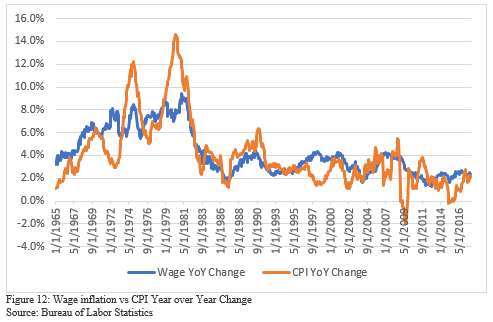
- Rate Uncertainties: The Fed is expected to raise interest rates three times next year, which helps drive up the short end of the curve and might flatten the yield curve even more. We expect the 10yr Treasury bond yield to rise and the yield curve (2s & 10s) may flatten further during the 2018. Even though an inverted yield is usually associated with recessions, we believe recession risk is low given continuous above trend GDP growth, low unemployment rates and a solid global economy. But as the labor market slack dissipates, further cyclical improvement should slowly take hold and lift wage growth, which could cause wage inflation to pick up in 2018. Historically, inflation is largely caused, or at least consistent with rising wages and the correlation between year over year wage increases and inflation is 0.80 (Figure 12). If wage inflation, tax cuts or other triggers cause higher-than-expected inflation in the other areas, it may force the Fed to raise interest rates faster and trigger a repricing in the financial markets and higher market volatilities. Too much of an aggressive Fed can lead to economical recessions and bear markets.
As we turn our attention to 2018, We believe the drivers for the strong market return are still valid. In our opinion, the secular bull market will stay intact but volatility will return for the following reasons:
- High valuation;
- A new Federal Reserve Chairman and other personnel change;
- Potential tax impacts
- A Tight labor market on inflation thus potential faster rate increases; and
- Geopolitical risks such as North Korea tensions.
We believe the market will have larger and healthier pullbacks than the 2.8% we had in 2017. Investors are cautioned not to extrapolate 2017’s performance into 2018, with the expectations bar now set quite high heading into 2018. Pullbacks are increasingly possible.
Here is to a successful 2018!
Buckingham Global Advisors LLC is a registered Commodity Trading Advisors (“CTA” and investment firm that believes safety and trust are the two most sought-after attributes among investors. Past Performance results are not necessarily indicative of future results. Futures trading is not suitable for all investors.
This newsletter is published by Buckingham Global Advisors LLC and Weiqin Dong is the author and editor of this market newsletter. The information contained herein was taken from financial information sources deemed to be reliable and accurate at the time it was published, but changes in the marketplace may cause this information to become out dated and obsolete. It should be noted that Buckingham Global Advisors, LLC nor Weiqin Dong has verified the completeness of the information contained herein. Statements of opinion and recommendations, will be introduced as such, and generally reflect the judgment and opinions of Weiqin Dong, and that these opinions may change at any time without written notice, and Buckingham Global Advisors LLC assumes no duty or responsibility to update you regarding any changes. Market opinions contained herein are intended as internal research and general observations and are not intended as specific investment advice. Readers are urged to contact their financial advisors for more information about the unique risks associated with futures trading and we encourage you to review all disclosures before making any decision to invest. This newsletter does not constitute an offer of sales of any securities.
Weiqin Dong, CFA
Buckingham Global Advisors LLC
© 2018
