Many commentator have talked about the fact that stocks and bonds moved together during the current market sell-off as if this is big news, highly unusual and signal of market change. A positive correlation is not the normal relationship we have seen in the post Financial Crisis period, but it may be a little early to say there is a sea-change in market behavior.
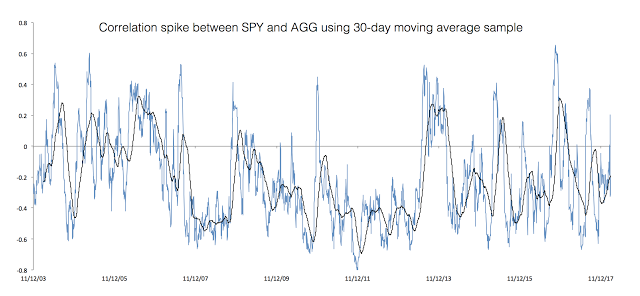
We looked at 30-day rolling correlation as a short-term measure for the period from October 2003 to the present February 2018 between SPY and AGG (the Barclay Aggregate Bond index) ETFs. There has been a spike in correlation but there have been other periods of rising positive correlation.
We get similar results if we use the Treasury ETF, TLT for comparison. We then took the 62-day (3-month) average of these numbers to provide a smooth result for our graph below. We will note that the correlation spike is under-reported given the moving average calculation.
There have been some noticeable extended periods of positive correlation even after the market decline in 2008. In fact, looking over our entire period, 25% of the time the correlation was positive. There even was a period of positive correlation in July of last year.
Too often market commentators will announce judgment without verifying the facts. It may be too early to say that there will even be positive correlation looking at the monthly data over the last year.
If fact, focusing on similar daily moves over a short period and making a judgment about correlations using longer-term time horizons and different time scales is dangerous. Our view is that diversification is working albeit not as well as expected using monthly data for asset allocation. In any large market move, return correlations increase. There is more risk, but it is not clear that this will significantly change relationship driving longer-term asset allocation


