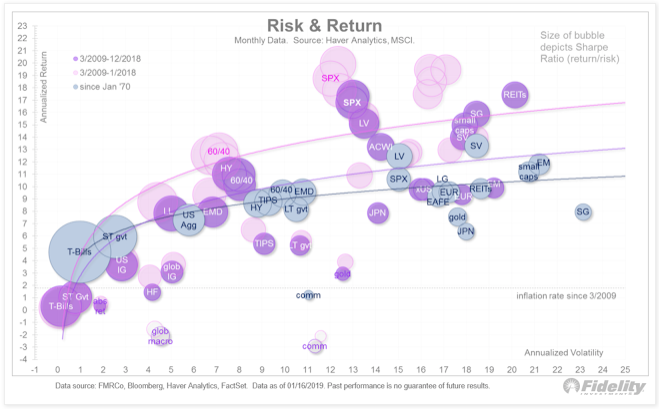
This is a very interesting chart of the efficient frontier from Fidelity for a number of reasons. On one level the return to risk locations for different asset classes are relatively stable, but there has been a mean reversion of returns during the fourth quarter that is pulling return to risk ratios back to long-term averages. Excess returns by definition cannot last forever. The fourth quarter was a correction to the long run and by the evidence in January perhaps an over-reaction.
As important as mean reversion is the fact that the efficient frontiers cannot be thought of as fixed lines. They are dynamic and changing through time with the sample of data used. Think of the efficient frontier not as a line but as a cloud. The efficient frontier for any three-year period is just a sample of the true return to risk. Another period will give a different sample. Each sample of returns will have errors and these error are what cause headaches for investors forming asset allocations.
Consequently, there is no single most efficient point on the frontier. The sample time period used, and the asset classes included affect the frontier. These are some of the important points made by Richard Michaud years ago that need to reinforced on a regular basis.
The efficient frontier is constantly changing based on the simple idea that it is only generated from a sample of data on return, volatility and covariance. The actual or expected returns will not match the sample. Hence, there can be multiple solutions to what is the most efficient portfolio for given level of risk.
Given the actual performance for asset classes will differ from the expected sample values, there can be wide variation in the results generated from an optimizer. This does not mean that there is a failure with optimization but that sampling matters. The optimal allocation will change with samples.
Investors need to think over multiple time periods. Investors should not overreact to short-run return information. Similarly, investors should understand medium returns like the last three years do not represent the long run. Perhaps this is one reason why looking at momentum and trends are important. Trends provides context for where we are and where we have been with price. Finally, the issue of sampling error reinforces the idea that diversification can offset the mistake of investment exuberance.

