

Much like cash-strapped Americans, the US government runs like a household on the edge. Rather than match incoming revenues with spending priorities, it uses its credit to make the minimum monthly payment. Fortunately, their income goes up almost all the time due to the hard work and ingenuity of its citizens. This will change at some point as interest rates get too high on the existing debt or the country’s GDP slows dramatically. Either will force a fiscal reckoning much like we saw in the mid-90s, which resulted in spending cuts. Unlike then, talk of fiscal prudence is rare these days. We analyze why that might be and where we end up.
Long-Term Spending Trends
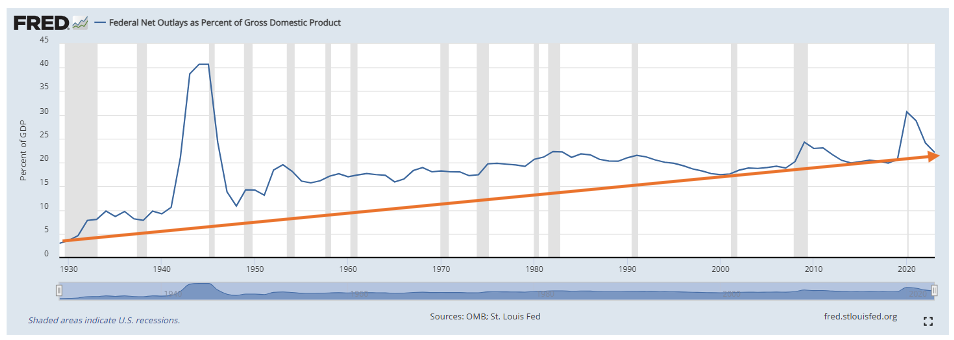
First, we look at spending growth over the long term. We notice that the trend is consistently higher, with massive spikes for World War II and more recent spikes during the recession of 2008 and the COVID-19 spike in 2020. Aggressive fiscal stimulus is becoming more commonplace as the Federal Reserve tries to manage the ups and downs of the economy. These recent spikes were supported by record-low interest rates along with coordination between other central banks performing similar measures. It remains to be seen if this will provide the long-term benefit of soft landings with limited repercussions.
National Debt and Interest Payments
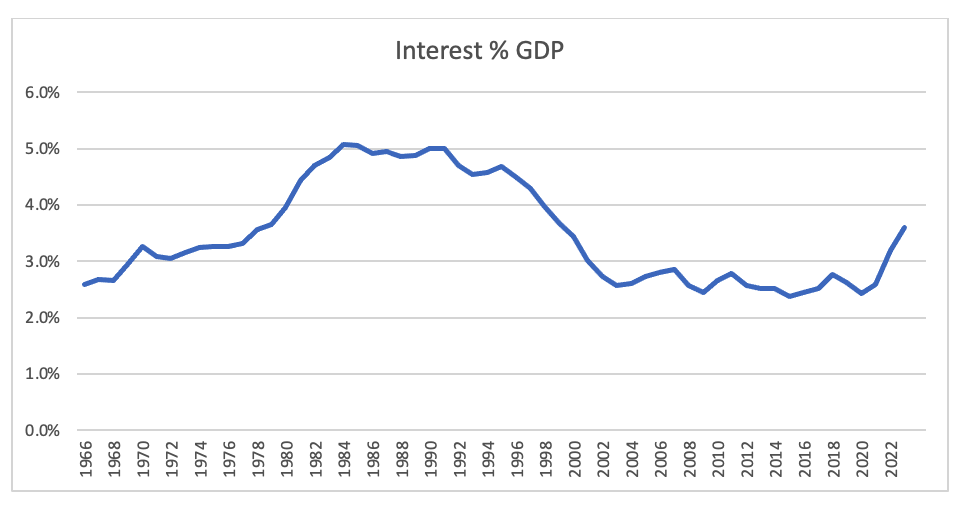
Despite this increase resulting in a national debt of $35.6 trillion, the interest payments remain reasonable in relative terms.
From 2003 to 2021, it ran below 3% of GDP levels. This is easily serviceable with the incoming tax flows and the growth rate projected from year to year. The sustained period of good fortune provided funds for expanded healthcare, income supplementation, stimulus, and environmental programs. However, the tide is beginning to change as COVID-19 debts collide with the rising interest rates needed to bring inflation into check. This interest is quickly approaching 4% of GDP, a level where inflows and outflows may begin to meaningfully diverge. Both candidates running for US President promise more tax breaks except for the “ultra-rich.”
Political Proposals and Wealth Taxation
Kamala Harris proposes taxing net wealth, which would amount to a levy on the total assets of some of the richest people on the planet. Fortunately, another country recently tried just that, so we can see how it works.
Norway passed a wealth tax in 2021. They expected this would generate an additional $150 million annually at a 1.1% levy rate on total assets. Predictably, many of their wealthiest citizens were mobile, and more than 30 moved out of Norway. $54 billion in holdings left the country, resulting in $594 million in lost revenue. California is proposing similar ideas, which would be even easier to avoid as the rich could flee to Texas and Colorado like many others before them. One might wonder why ideas like this keep getting proposed.
The U.S. Tax System and Dependency on Government Benefits
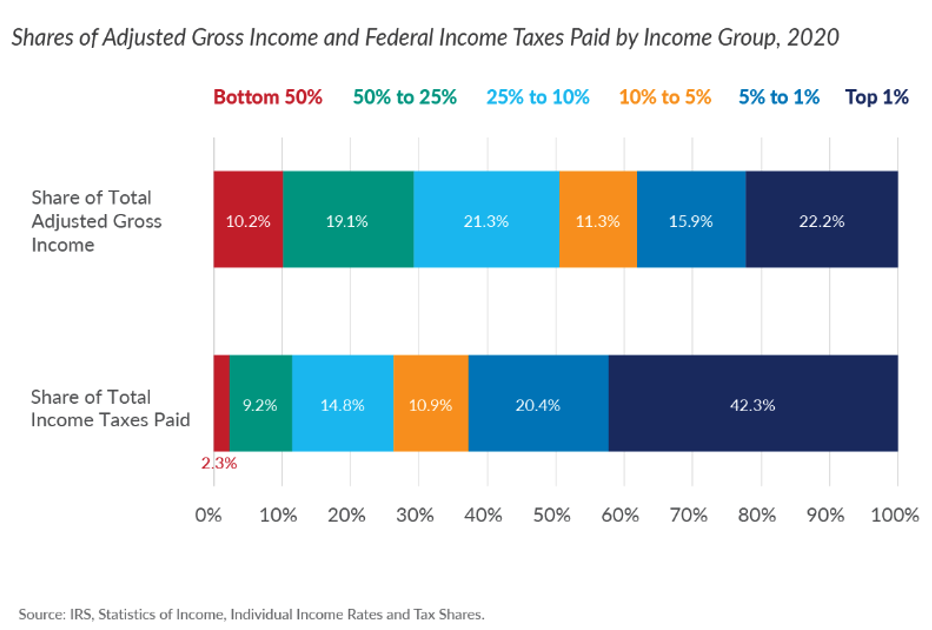
In the United States, the top 1% of earners pay over 40% of all income tax, and the bottom 50% pay just 2.3%. This seems to satisfy the goal of a highly progressive tax system where the rich pay more and those of lower means pay less. In 2019, 100 million Americans received government benefits of some sort. This number increased dramatically in 2020, so even more people depend on government revenue to maintain their lifestyle. With a working population of 174.6 million, which includes 25 million government employees, you have just 149.6 million workers responsible for financing these benefits in a country of 337 million. This provides context for the idea of taxing these individuals even more. They are vastly outnumbered.
Rising Debt Relative to GDP
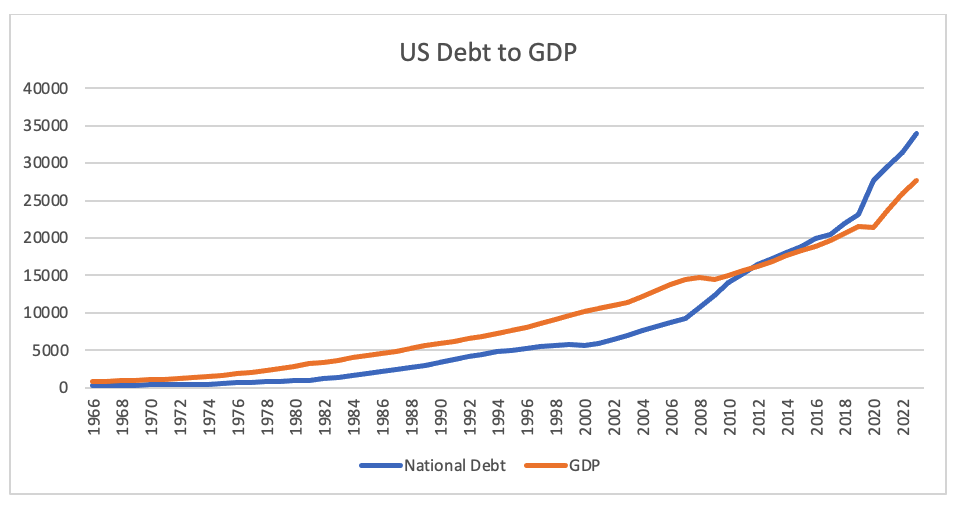
Beginning in 2008, the national debt relative to GDP began to climb, quickly surpassing total GDP in 2013. This acceleration is picking up speed. This puts us on a perilous course if rates spike as we push past the critical relationship of matching debt and interest load to the economy’s ability to support such payments. With 47.7% of people paying no income taxes, promises not to raise taxes on the lower half can be a winning strategy in the near term. Ultimately, there may not be a choice.
Eventually, an interest-only loan comes due, and for the United States, that day may be approaching more quickly than expected. Getting the biggest house you can get approved for did not work out in 2008, and this won’t either. In the meantime, politicians are content to keep charging it to the company credit card and suggesting that the rich will pick up the tab. We should learn our lesson from Norway and find a different path now.
Photo by Cindy Tang on Unsplash