
Mark Rzepczynski, Author at IASG
Prior to co-founding AMPHI, Mark was the CEO of the fund group at FourWinds Capital Mgmt. Mark was also President and CIO at John W. Henry & Co., an iconic Commodity Trading Advisor. Mark has headed fixed income research at Fidelity Management and Research, served as senior economist for the CME, and as a finance professor at the Univ. of Houston Baer School of Business.
Manage Investments Like Leonardo da Vinci – Think Out of the Box, Be Curious
I have just finished reading the insightful biography of Leonard da Vinci by Walter Isaacson. Isaacson makes da Vinci accessible as a person. HIs description really struck me. Da V+inci should not be placed on a pedestal of genius. He had a humble beginning. He did not have the schooling that others received during the period. What he did have was relentless curiosity. If you look at his notebooks or his art you will see his incredible power of observation and a mind that was not limited by conventionality.
Bear Markets Are Unavoidable – So What Are You Going To Do About It?
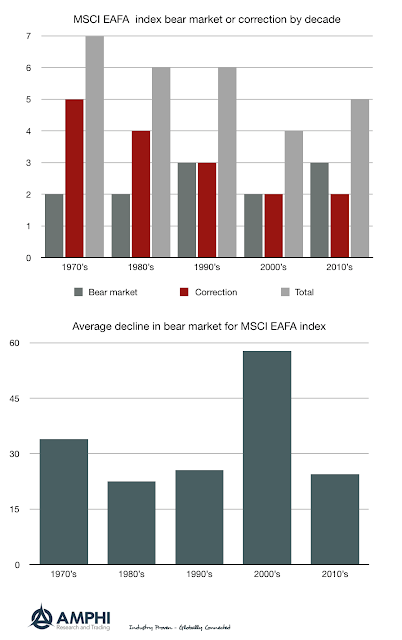
How often should you expect equity bear markets? Using the global diversified MSCI EAFA index, we calculated the number of bear markets, moves down greater than 20%, and corrections, move down greater than 10%, since 1970 by decade. (Hat tip to Ben Carlson of “A wealth of Common Sense” for providing the raw data for developing these charts.) The numbers suggest that you will get 2-3 bear markets per decade. The number of corrections or bear markets total 4 to 7. The average decline of the bear markets is variable. The 2000s decade was horrible with two bear markets more than 50%.
Alternative Risk Premia Showed Varied Performance Over The Last Year
The new HFR bank systematic risk premia indices provide a wealth of information on this growing and important investment area. All alternatives risk premia are not created equal. A review of the return performance over the last year shows that there were clear winners and losers.
2/20 Fees – DOA, Dead on Arrival – The Changing Market Structure for Hedge Funds
The film noir, “DOA”, had a great premise – a man staggers into a police station and wants to report a murder – his own. He was poisoned and had a limited time to find his killer and why. The hedge fund industry 2/20 fee schedule is dead. Some managers may not know it yet, some are in denial, but it happened and now it is just a matter of sifting through the suspects to find the killer.
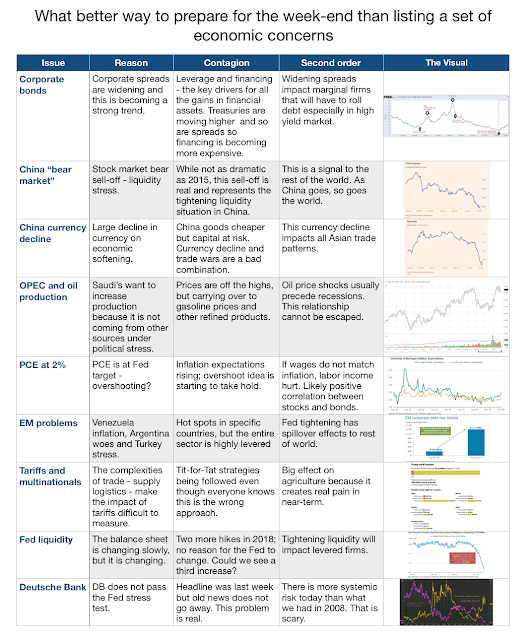
If You Need Something To Give You Financial Worries This Weekend, This List Will Do It.
The employment report for June was positive with both job creation strong and the participation rate higher. This is reflected in the stock market, but there are still growing clouds of economic and financial concern.
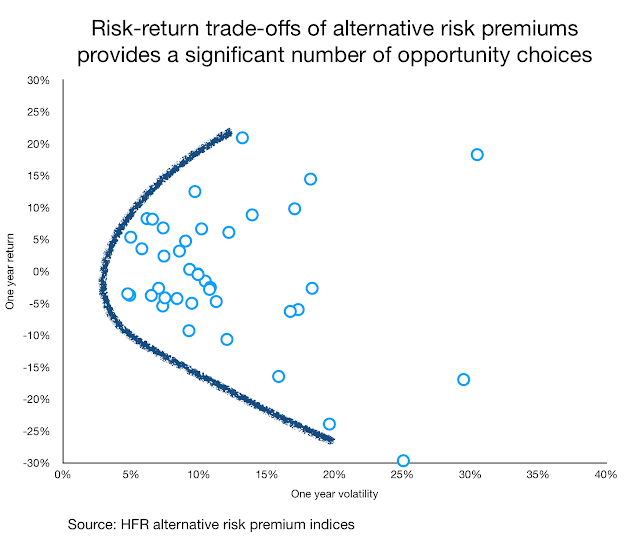
Alternative Risk Premium Indices – Providing insight on what is possible in the ARP space
HFR, the hedge fund index provider, announced a new set of indices based on alternative risk premium strategies generated from banks. This is a major advancement in transparency for investors and shows the strength in this growing sector of investing.
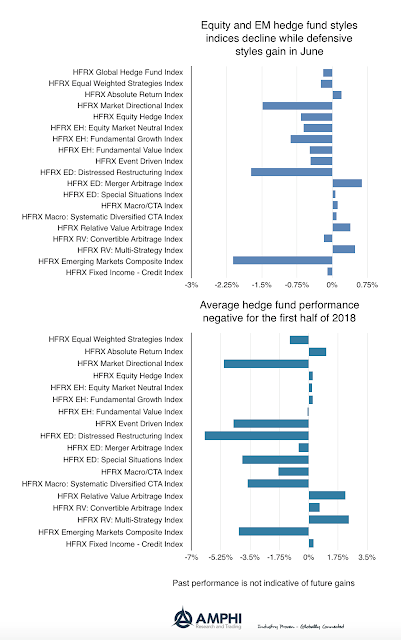
Hedge Fund Performance Poor for 2018 – Limited Alpha Generation
Hedge fund styles as measured by the HFR indices, on average showed negative performance for June. EM strategies were the hardest hit sector. The only bright spots were merger arbitrage, defensive strategies like global macro and relative value. The general decline in equity markets globally and more mixed performance in the US held back returns.
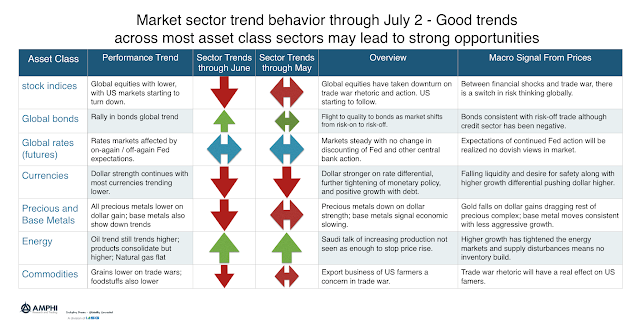
Strong Trends Across Most Asset Class Sectors Point to a Strong Opportunity Month
A review of trends in each of the major asset class sectors shows that there should be a strong return opportunities in July. Global stock indices are declining on trade war rhetoric and action. This growing sense of risk has spilled-over to bond markets through classic risk-on/risk-off behavior. Bonds have gained even with the threat of higher inflation. The dollar looks to continue its up trend as money flows back to the US and away from EM. Precious metal prices have fallen on the dollar strength. In spite of the Saudi’s willing to increase oil production in response to falling inventory, oil prices have continued to trend higher. Grain prices have fallen on fears of a trade war in agricultural exports to China. The general direction in commodity prices has been lower.
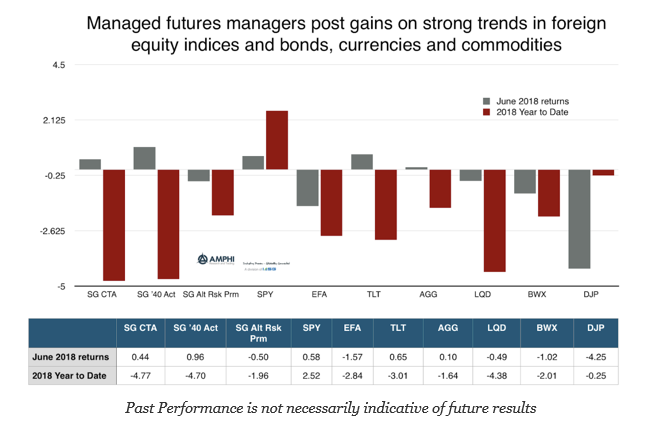
Managed Futures Show Gains versus Other Asset Classes Based on Good Trends
Based on the performance of the SocGen indices, the average managed futures fund generated positive returns for June. The performance of the Barclays BTOP also was up 59 bps and is only down three percent for the year. Managed futures outperformed all of the major asset class ETFs based on strong trends across a number of asset classes.
Hotter Financial Markets Will Match Summer Heat – But That May Not Be a Positive
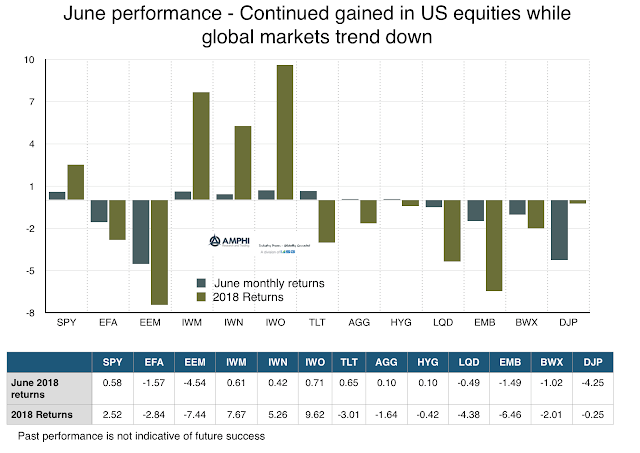
There is a US/Global equity market disconnect. The higher US growth, optimism, and fiscal stimulus (tax and debt financing) have created a positive economic environment for the US that is not seen in the more lethargic global economy. US growth is expected to surge above 4% for the second quarter (per the Atlanta Fed nowcast) even with slight downward revisions for the first quarter. Global growth is not bad and is expected to exceed 2017, but economic shocks in the EU and EM and tightening China liquidity have all contributed to more fragile global stock markets. China equities, at least measured from the high, are in a bear market.
Downside Risks Abound – Beware of Summer Heat for International Investments
There is a large disconnect between US equities and global equities. The US equity markets seem out of touch with the financial difficulties seen in other parts of the globe, albeit recent price action suggests downside risks increasing. The gap between the small cap and emerging market indices is now above 15% for the first half of the year. Still, there are signs that the disconnect will not last as most styles have fallen below short-term (20-day) moving averages.
Risk Should Not Be Determined by Feelings of a Past Experience – Block the Perceptions and Focus on Some Numbers
Risk perception is often about pain and not probabilities. It is about the experience of risk not the mathematical chance or size of loss. I would like to say that everything about risk management is measurable and can be reviewed dispassionately, but that is not the case. There is often a difference between fear and facts and this is the perception gap which often leads to bad judgment. You may be a dispassionate risk assessor, but the market’s perception of risk may be driven by its weighted perception of the risk.
The Power Law, 80/20 Rule, and Concentration of Returns – What It Means for Money Managers
The power law has been become a strong fascination to me. We have been trained to generally think about the normal distribution. The law of large numbers has been pounded into our psyche since our first class in statistics but as you look more closely, the more relevant the power law becomes. Now, a normal distribution will produce extreme values. However, in a power law the extremes follow certain characteristics such that the “top few” are unbundled or more likely to have an extreme, (as opposed to a normal distribution where the “top few” are exponential and bounded).