
Mark Rzepczynski, Author at IASG
Prior to co-founding AMPHI, Mark was the CEO of the fund group at FourWinds Capital Mgmt. Mark was also President and CIO at John W. Henry & Co., an iconic Commodity Trading Advisor. Mark has headed fixed income research at Fidelity Management and Research, served as senior economist for the CME, and as a finance professor at the Univ. of Houston Baer School of Business.
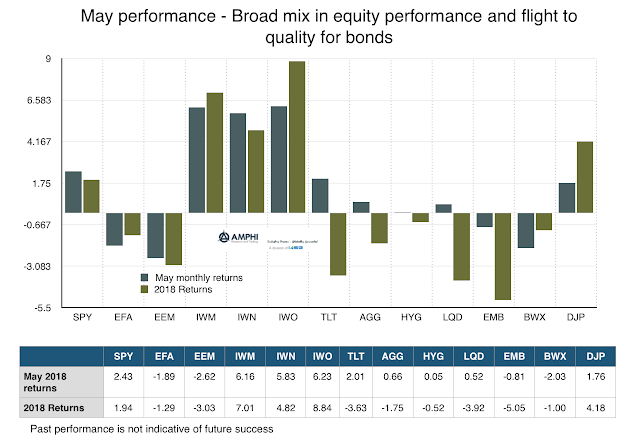
Monthly Performance Does Not Follow an Expected Return Script – Improvisation in Value, Growth, and Small Cap Indices
One way to measure market uncertainty is to run a simple thought experiment. A well-behaved market should match performance with events in a well-defined manner. An uncertain complex market environment would behave in an ill-defined manner. Close your eyes and assume you have knowledge of the news highlights for the month of May. For example:
Political turmoil in Italy and the EU
Off-again/on-again North Korea talks
Good economic data albeit with lower momentum
EM problems in Turkey and Argentina
Trade war discussions
What Keeps Me Up at Night – “The Glaringly Evident that We Have Decided not to See”
“The hardest thing to explain is the glaringly evident which everybody has decided not to see.” Ayn Rand
Noise Versus Bias – We Focus on Biases, But it is the Noise that Hurts Us
“We have too much emphasis on bias and not enough emphasis on random noise”
– Dan Kahneman Speaking at the Kahneman-Treisman Center for Behavioral Science and Public Policy

You May Not Want to be Bound to an Algorithm – So Use a Dashboard as a Decision Support Tool
The benefits from using algorithms are well documented, yet they are still not used for many decision-making situations. The reasons for this lack of use are varied. It could be self-interest. It could be algorithms anxiety. It could be a lack of confidence in the modeling process. If there is a high level of uncertainty concerning the most effective model, there may be fear of being wrong.
Kahneman on Silence – Turn down the Noise through Turning up the Algorithms
“An algorithm could really do better than humans, because it filters out noise. If you present an algorithm the same problem twice, you’ll get the same output. That’s just not true of people.”
“But humans are not very good at integrating information in a reliable and robust way. And that’s what algorithms are designed to do.”

What is Beta for Commodities? There are Big Differences
An investor may want to increase his commodity beta exposure to meet his strategic allocation target for this asset class. Unfortunately, all betas are not created equal in the commodity space. There is a wide difference in the choices that are available and this chasm is much greater than anything found in other asset classes.
Using Scenario Analysis to Help with Asset Allocation – A Simple Solution to a Complex Problem
The reason for asset allocation scenario analysis is simple. There is a whole crowd of investors who do use or are uncomfortable with formal decision-making employing optimization. Quantitative asset allocation models like Black-Litterman, while elegant in theory, have not caught-on with many who are on the frontline of asset allocation work. Running scenario analysis provides a useful thought experiments tool to help refine asset allocation choices.

Correlation Changes across Stocks – An Important Risk for All Portfolios
The average correlation across stocks (intra asset class) has important implication for portfolio construction and for active management. The chart below from Wisdom Tree shows average stock correlation since the Financial Crisis. It has been subject to sharp increases followed by declines. Our general view, consistent with this data, is that if there is a single factor macro event, there will be a corresponding increase across all stocks.
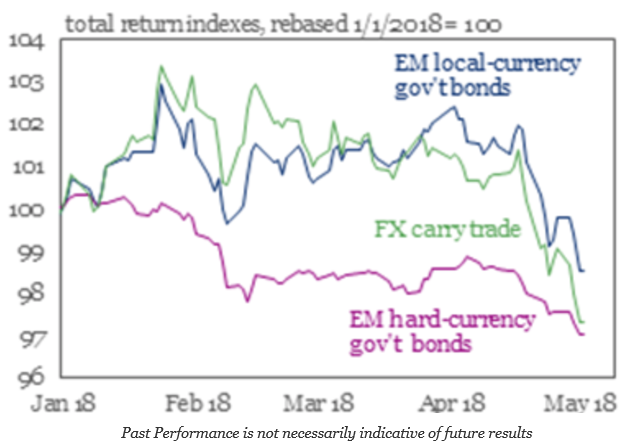
EM Vulnerable to Shocks? “Taper Tantrums” and Getting Ahead of the Curve
Emerging market stocks and bonds are facing difficult times in 2018. Emerging markets may have looked like potential outperformers at the beginning of the year, but they have now fallen below respective US stock and Treasury indices. This sell-off has been further enhanced by the negative economic events in Argentina. Higher volatility, rising interest rates, […]
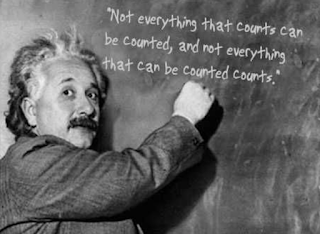
The Countable Non-Countable (quant versus narrative) Problem – Focusing on what is Important for Investing
“Not everything that can be counted counts, and not everything that counts can be counted.”
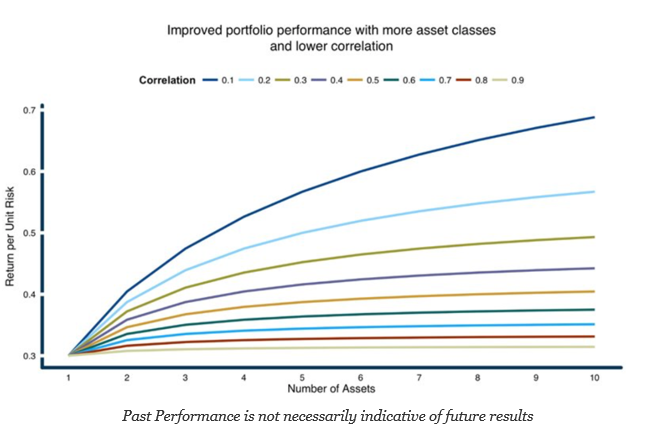
The Single Most Important Chart for Any Portfolio Manager or Investor – The Power of Diversification (Low Correlation)
Global diversified, multi-strategy, multi-asset class, portfolio of alt risk premiums, portfolios of traders – it does not matter what is the combination – Get more diversification and you will be a winner. When someone says “diversification is the only free lunch in finance”, the phrase may not truly resonate as well as a picture, and the picture above says it all. I can honestly say that for all of the educating in investments, this picture is not used enough.
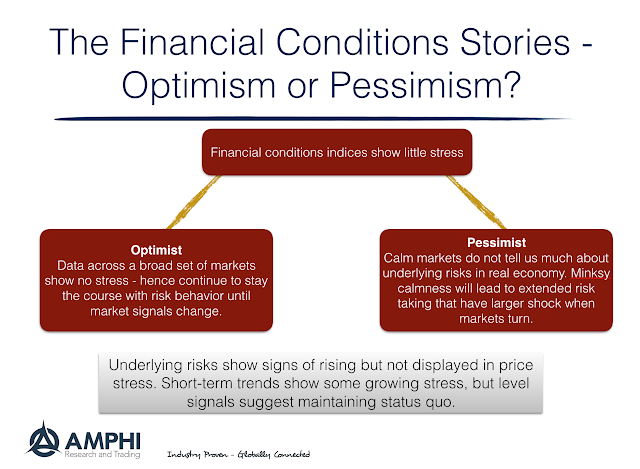
Financial Conditions are not Suggesting Stress – Be Optimistic?
The Office of Financial Research (OFR) Financial Stress Index is not showing any signs of a problem in financial markets albeit conditions worsened in February. It is notable that all sectors, credit, equity, funding, safe assets and volatility are closer to post Financial Crisis lows than the spikes in 2011 and 2016. Of course, the construction of the OFR stress index only includes financial spreads or price information and no fundamental information. Prices may lead economic financial stress and can be a cause of stress but it does not tell us about the drivers of financial pricing.

Give Me Some Metrics! Beware of those Metrics
I have been one of those “if you cannot measure it, you cannot manage it” types. Most quants are like this, but there are limits to measurement or trying to fit qualitative characteristics into a measure. Difficulty does not mean that attempts should not be tried. Most will admit that measurement is very useful in some areas of study but have to be more tempered in others. Jerry Muller, in his book The Tyranny of Metrics, explains the potential problems of a culture that focuses too deeply on measurement. This is a good counter to the always measured to manage crowd.