
Mark Rzepczynski, Author at IASG
Prior to co-founding AMPHI, Mark was the CEO of the fund group at FourWinds Capital Mgmt. Mark was also President and CIO at John W. Henry & Co., an iconic Commodity Trading Advisor. Mark has headed fixed income research at Fidelity Management and Research, served as senior economist for the CME, and as a finance professor at the Univ. of Houston Baer School of Business.
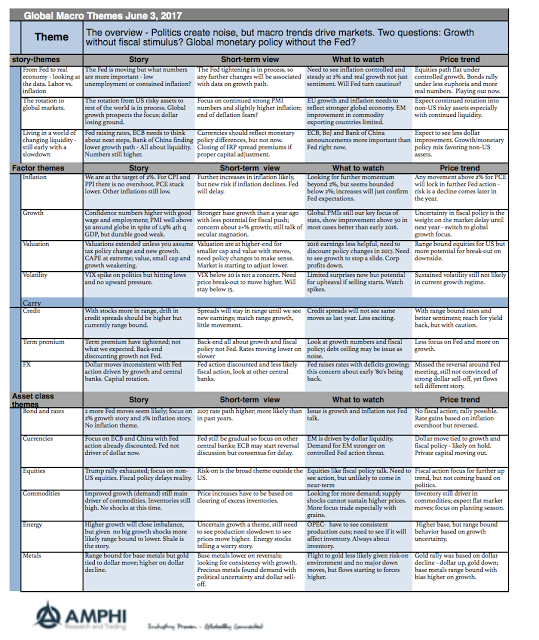
Global Macro in One Page – Forget the Noise and Watch the Numbers
As a more quantitative focused analyst, I keep focus one thing – the numbers. Stories are good, but numbers are better. At best stories, provide context for numbers, but stories of politics will not lead to market trends. Capital flows on trends in profits, growth, liquidity, and risk. Do not suffer from “shiny object” syndrome. The news of today may not impact the important fundamental trends.

Sector Behavior Consistent with Economic Story but Wider Dispersion
While large cap and international stocks continued to move higher, the markets are starting to see more dispersion with small cap, growth, and value indices all posting negative returns for the month. The Russell value index has fallen to negative returns for the year. A growing dispersion is also evident in sector and country returns. Bonds have been a safe asset with positive gains for the year across all sectors. The returns are consistent with slow but positive growth around the world with controlled inflation.
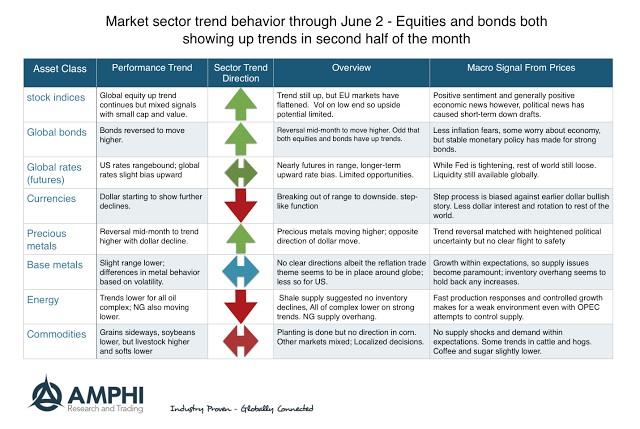
Trends for June – Up for Equities and Bonds
May was a mixed month for many trend-followers. Some did well while others got caught on the wrong side of mid-month reversals. The month saw a mid-month equity sell-off which could have stopped-out a number of key positions in equities and bonds. This sell-off was based on political uncertainty and not macro fundamentals.
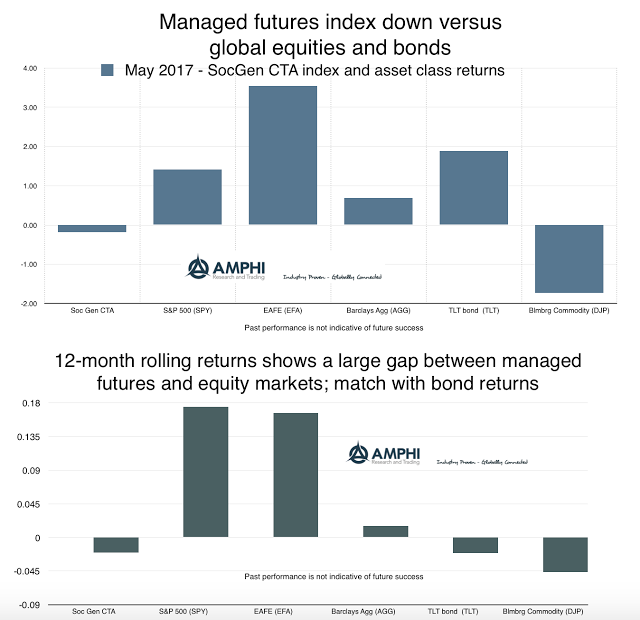
Managed Futures – All dressed up but not Going Anywhere
Money has flowed into managed futures under anticipation that there will be a crisis event that will need the diversification benefits of trend-following strategies. These investors adjusted portfolios away from perceived overvalued assets to the value from long-short diversified trend-following. What is the sense of increasing allocations after the divergent event of a equity sell-off?
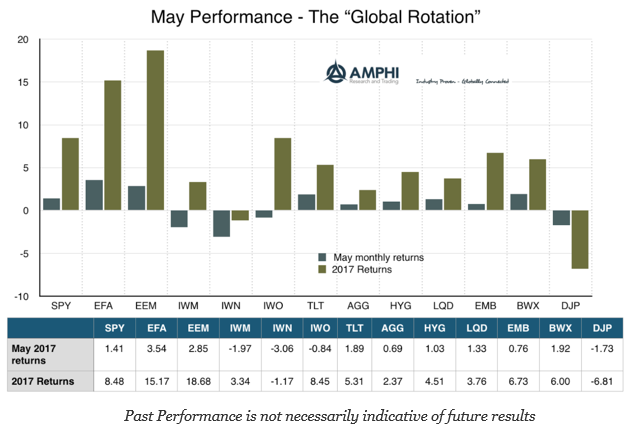
Asset Class Performance – The “Global Rotation”
Call it the “Global Rotation”, but last month was a continuation of what we have seen for the year. There has been a flow of money into international stocks and increasing divergence between the rest of the globe and US risky assets. There is a dollar adjustment component to these returns, but there is no mistake that there is a preference for cheaper opportunities around the world.
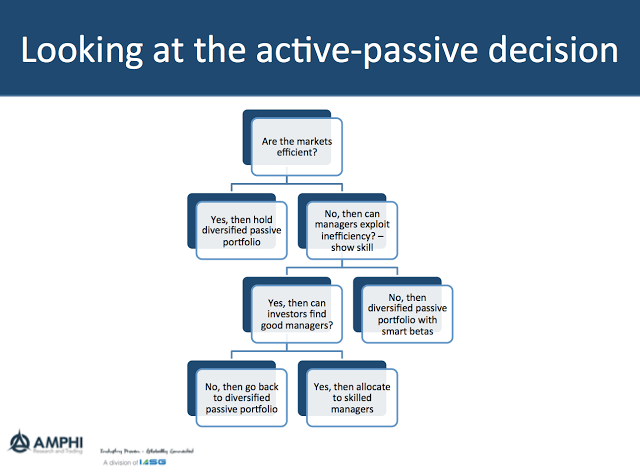
Simplifying the Choice Between Active and Passive Investing
The choice between active and passive investing has been a battle that has been raging for years, but it can be simplified through a set of easy questions. The answers to these questions are not easy, but by forming a direct set of straightforward questions with a decision tree, the issues can be discussed in […]
Avoid Atheoretical Data Analysis – A Rule for any Data Specialist
The process of scientific discovery, even within finance, is essential. One approach to finding new strategies could be to generate observations and then provide explanations, such as an inductive approach. The other is to first form a theory and then test a hypothesis, deductive reasoning. Much of machine and statistical learning is inductive reasoning, where […]
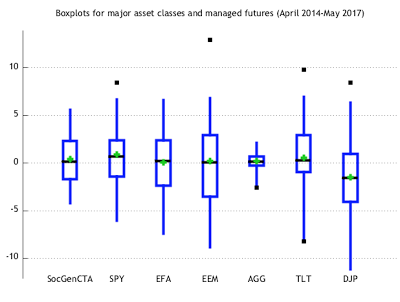
Looking at Asset Class Risk through Boxplots
Investors are so used to looking at standard deviation to define risk that they forget some easy exploratory data analysis tools that can be very helpful. The boxplot focuses on a greater description of the data through a simple display of a brand array of information. The box is formed by the first and third quartiles, the whiskers are 1.5 times the interquartile range, the green diamond is the average, and the black boxes are the outliers.
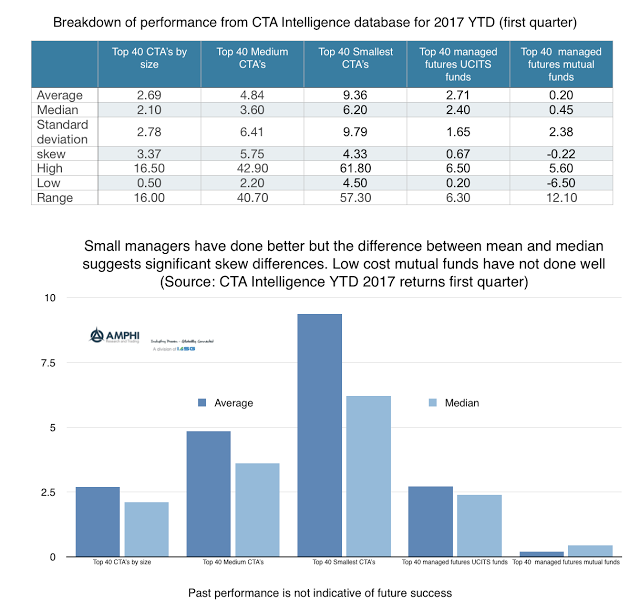
Size Matters with Managed Futures but Not Just with Performance
There has been a preference for large managers within the managed futures space as measured by money flows, but it comes at a cost. Looking at year to date performance from the CTA Intelligence performance database shows the differences in performance based on size. What is clear is that the average performance of a set of 40 small managers is significantly higher than the performance of the largest 40 managers. Going down in size will allow clear increases in average return and with median returns; however, a closer look shows that the price of obtaining higher returns can be high in terms of regret.

Trading Gold Futures – CME vs. LME – This Could be an Interesting Battle
With a new regulatory environment, the traditional gold market is up for grabs. While many of the changes have not been direct to the gold market but based on a broader environment, regulation is changing the market structure for trading in gold. Regulations which increase the cost of trading over-the-counter has and will push gold trading onto exchanges, centralized counterparts (CCP’s). This environmental change is the opportunity for new exchange entrants in the gold market. We have already seen new trading through ETF’s over the last few years change gold dynamics and now there is the opportunity for changes in futures trading.
The Effectiveness of Managed Futures: Exploring Trend-Following Strategies
Why is managed futures or, more precisely, trend-following an effective investment strategy? Many managed futures programs have been successful by keeping it simple and using heuristics like following the price trend and not always using all the available information about a market. Disciplined and systematic decision-making seems to be a robust means of dealing with […]
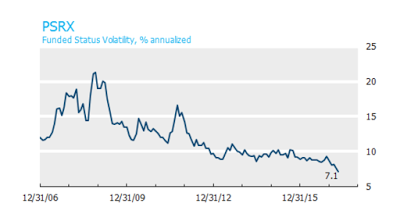
Pension Surplus Risk at all Time Lows
The Funded Status Volatility index (PSRX) from NISA is a useful tool for understanding pension risk exposures. It is an aggregate of the risks for pension based on the combination of assets and liabilities associated average allocations for the 100 largest pension funds as measured through public information and 10-k filings. The index, which represents $1 trillion in AUM, will move up and down with the volatility of all asset classes. Hence, falling equity and bond volatility as well as changes in the discount rates will translate into a falling PSRX index.
Volatility and Managed Futures – Is There a Relationship with the VIX?
Many believe that managed futures is a long volatility strategy because the strategy is like being long a look-back straddle. We believe there is a more nuanced story associated with long gamma exposure, but let’s use the prevailing wisdom of long volatility as a starting point for a discussion.