Mark Rzepczynski, Author at IASG
Prior to co-founding AMPHI, Mark was the CEO of the fund group at FourWinds Capital Mgmt. Mark was also President and CIO at John W. Henry & Co., an iconic Commodity Trading Advisor. Mark has headed fixed income research at Fidelity Management and Research, served as senior economist for the CME, and as a finance professor at the Univ. of Houston Baer School of Business.

LMEprecious – Joining the Futures World?
Any managed futures trader will tell you that trading metals on the LME is much more difficult than other “futures” contracts. Structural differences make for a more challenging environment from monitoring and capital usage to transaction costs. The continuous forward contracts of the LME are just more difficult to trade than the focused discrete delivery dates of futures because market liquidity is spread over a wider set of dates. Even if liquidity is centered at a three month prompt, the liquidity on exit before expiration may be more difficult to find.
Managed Futures vs. Tight Financial Conditions: Who Wins in the Battle of Investment Strategies?
Financial conditions can inform us about periods when thises and market dislocations will occur. The graph above shows the time series for the Chicago Fed adjusted financial conditions index. The index measures liquidity, risk, leverage in money, debt, and equity markets, and traditional and shadowing banking measures. If the index is positive (negative), financial conditions […]

Strong Non-US Returns for the Quarter – End of the Trump Effect?
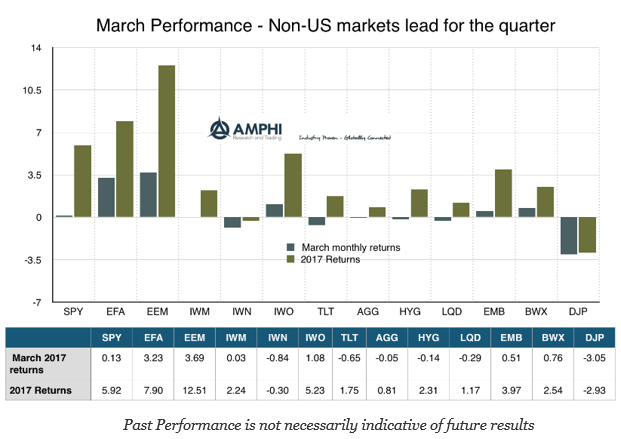
The capital flows and returns for the month and quarter tell a risk-on story for global markets. This is not the case for the US where equity returns were at best flat and bonds showed negative returns in March. The dollar sold off for the month by slightly less than one percent as measured by the DXY dollar index. Even if we account for the dollar tailwind for international stocks, global equities did better than the US by well over 2% for March. Emerging markets have seen the best quarter in years with double-digit returns. Adjusting for the dollar would have placed international and emerging market bonds in-line with US bond returns.

Trends and Break-Outs – No Strong Directions for any Sectors
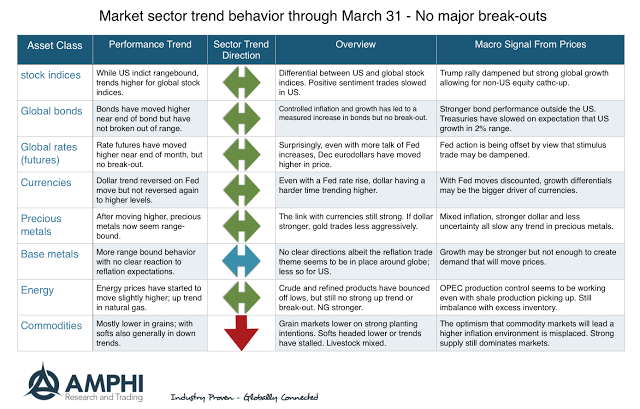
For most managed futures managers, the modeling task is simple, look for trends or break-outs. Managers are not predictive but reactive to what market prices are doing. Looking at the current price data across the major sectors provide little evidence of strong trends or break-outs. Trends that seem to be currently developing are not strong enough to move beyond recent highs, so our trend sector matrix is showing sideways to a slight up moves across most sectors with the only strong trends in commodity markets.

Golden Rule of Forecasting – Be Conservative
One of the leading experts on forecasting is J Scott Armstrong, from the Wharton School. He has produced numerous papers and books on forecasting but has encapsulated all of his decades of thinking with his paper, The Golden Rule of Forecasting. There is a right and a wrong way to do forecasting and Armstrong walks through the key issues, whether it is through an econometric model or a judgmental forecast. His golden insight is that when in doubt be conservative. More deeply, his comment is that the forecaster must seek out and use all knowledge relevant to the problem, including knowledge of methods validated for the situation.

Trend-Following, Portfolio Insurance, and Market Selling Pressure
A recent FT article, “Rise in the new form of ‘portfolio insurance’ sparks fear – Popularity of trend-following funds – and their promises – carry echoes for some of 1987 crash” focused on the threat of trend-following to create selling pressure on equity markets. This speculative topic has been a recurring theme for decades and has been extensively researched. The empirical question is very straight forward. Do futures prices lead cash prices and are futures prices driven by systematic trend-followers? That is, is there a positive feedback loop whereby the selling of equity futures by some strategies will lead to more selling and a price crash? The research on the impact of speculators has generally shown that this is not an issue.

What Kind of Model to Choose?
Approaches to modeling go through fads and fashions. What was learned yesterday by MBA’s will be the model of choice tomorrow. Certain approaches are employed because that is the approach the modeler wants or likes. The same applies to strategies. A value investor will not likely to turn into a growth investor. He likes that sort of thing. A quant will not become a discretionary storyteller. He likes the precision of the model.

Dollar Variations – The Two Main Levels of Uncertainty
What makes currency forecasting so difficult are two levels of uncertainty. This uncertainty is playing out today with the dollar declining on the Fed raising interest rates.

Drawdowns – Worth a Closer Look as a Risk Measure
While there is a strong interest in short-term return performance and volatility of hedge funds, drawdown is still the risk where most investors have placed their focus. Maximum drawdown, as a risk measure, can be formalized as the conditional expected drawdown or the measure of the tail mean of a maximum drawdown distribution. The figure below shows what that distribution will look like. What makes this risk measure especially useful is that it can be employed in any optimization and has a linear attribution to factors. Maximum drawdown can have traded off against return or specific risk factors. It can be compared or related to the marginal contribution of risk measure which has gained popularity with many investors.

Robust Control and Managed Futures
How do we know whether a model is right if we are running a systematic managed futures program? This is not an easy question because a significant amount of data is necessary to distinguish the difference between models. Plus, there is just the uncertainty of structural changes, regime changes, and parameter variability which ensures that the best model yesterday will not be the best today or tomorrow.

Absolute Strength Momentum and Trend-Following
Relative strength momentum has become very popular as an investment strategy. It is a relatively simple strategy and has been the driver of most of the equity momentum work, buy recent winners and sell recent losers as a long/short portfolio. This is not really a trend-following strategy because the focus is on relative performance and not on the time series movement in stocks

The Stock-Bond Correlation Curve
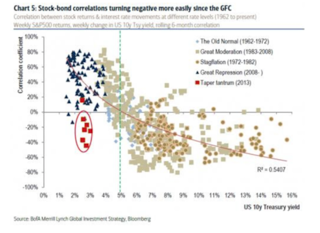
There has been a strong positive relationship between the correlation between stock and bonds and the level of yields. As rates have declined the stock-bond rate correlation has moved from negative to positive. This is a phenomenon which has been found around the world in all major markets. Many analysts have measured this through equity and bond returns (prices) which will show a strong negative correlation. The secular decline in inflation has pushed down bond yields during a time of long-term equity gains. Similarly, the decline in real yields through a fall in bond risk premiums has also been associated with an increase in stocks.

Disaster Risk – Priced in Risk Reversals
There has been a lot of discussion about crisis alpha with some hedge fund strategies like managed futures and the need for investors to build portfolios which will provide some crisis risk offset. There has been less talk about what is the definition of a crisis or how to measure the chance of a crisis.