Category: Advisor Commentary

Everyone Loves a Comeback
In February 2018, markets looked pretty dire for many option writers. The VIX had spiked 250% in less than a week and options sold a few days before were selling for many multiples of their original value. The biggest firm in the space, LJM Partners, went under and some of the best names faltered. Tianyou […]

NuWave Investment Management – Politics & Markets
While only time will tell if the potential impeachment of President Donald Trump is more sideshow than substance, the fallout from the impeachment inquiry and any subsequent hearings will likely pale in comparison to the potential ill effects of a destabilizing escalation in the trade war with China, an unanticipated surge in U.S. inflation data (which would, in turn, force the Federal Reserve to tighten rates in an aggressive fashion) or a continuation of the profligate spending policies of a spendthrift Congress. Ultimately, markets either rise or fall based upon the underlying health of the economy – not the political drama being staged in some Congressional hearing on Capitol Hill – and it is likely that the economic policies pursued by the Trump Administration (e.g., tax cuts, jobs growth, fair trade, rising corporate earnings, deregulation, etc.) have made the U.S. economy – and the U.S. stock market – more resilient to all manner of near-term shocks . . . even political ones.
Sigma Advanced Capital – Disruption in the Energy Markets
Today Oil surged around 14% after the Saturday attack on Saudi Arabia Oil processing complex Abqaiq. Meanwhile, there is uncertainty as to if the Aramco will be able to restore full capacity, while the US is blaming Iran for the aerial attacks, increasing geopolitical Risk.

Warrington – The return of Volatility
Disclaimer: While an investment in managed futures can help enhance returns and reduce risk, it can also do just the opposite and in fact result in further losses in a portfolio. In addition, studies conducted of managed futures as a whole may not be indicative of the performance of any individual CTA. The results of […]
Third Street Ag – How low can they go?
This summer’s theme could well have been: How low can they go? The “they” was supply and demand. Unfortunately, the competition looked more like a cage match than a limbo contest. In that analogy the heavyweight match was certainly Prevent Plant (PP) versus African Swine Fever (ASF).

Breakout Funds – Toxicity
Last night was a great chance to opportunistically be long of risk, short the long end of the curve. We got some incrementally positive news on the China front on the Europe open and, risk pushed higher, and steepeners were put out. Bears were sent scrambling to wait for the grownups to come back from vacation.
Third Street AG July Commentary
Data and information is provided for informational purposes only, and is not intended for trading purposes. Neither IASG or Third Street Ag Investments LLC nor any of their data or information providers shall be liable for any errors or delays in the data or information, or for any actions taken in reliance thereon. We do […]

Managing Money: It’s basically all noise, with a few exceptions
Noise and an overwhelming amount of data is the biggest challenge in managing money in 2019 (or anytime in the past decade). In the 1960s, 1970s, and even the 1980s, delivering alpha came down to having access to information others didn’t have – the process of obtaining data was a value-add. Today, we have the complete opposite problem. In 2019 we have too much information, and delivering alpha comes down to paring things back to their essence, stripping away unnecessary garbage.

What does it mean for an investment strategy to be “robust”?
In the business of managing money, there is a key word that often comes up but is easily misunderstood: robustness. What does it mean for an investment strategy to be “robust”? What does a robust strategy look like? Is it something that most investors find palatable? Look at the following returns for two different managers, Mr. low vol and Miss robust.
Why Trend-Following and Automated Systems are No Longer Enough in the CTA Space
The CTA space has struggled mightily over the past 10 years. We believe a CTA manager with a proprietary trading skill set, proven over time throughout various market regimes, is the necessary future of the industry. Trading proprietary firm capital under an SMA structure can have multiple benefits. This way, firms do not have the overhead and headache of bringing on a new trading team. Both parties are free to focus on what they do best; trading and managing risk.

Sector Trends Show Significant Changes Over Last Month
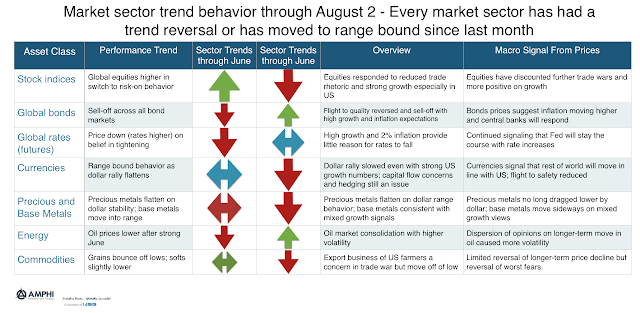
Our tracking models for the end of July show that there have been changes in direction for all major sectors. This would usually suggest significant loses for trend managers but the relatively mild volatility and the slow reversals allowed for adjustment of signals to mitigate loses.

July Performance Shows Risk-On Appetite
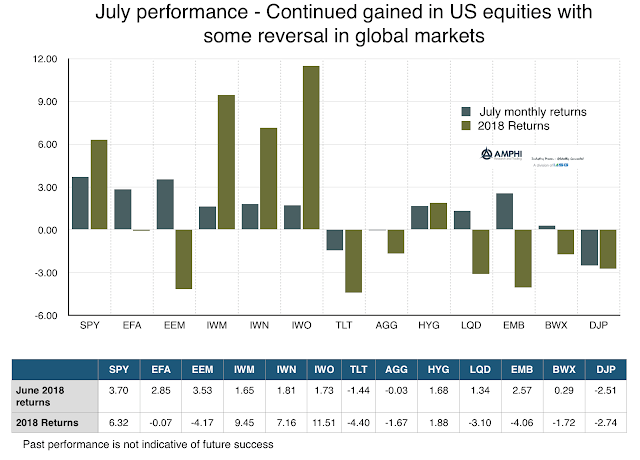
First look at the data to see what weighted market opinion is telling us. July marks a reversal to more risk-on behavior with strong gains in large cap US stocks as well as international and emerging market equities. While small cap, growth, and value indices all did well, the broader international concerns affecting risk behavior have abated. This positive global view was also seen in the international bond markets. The dollar rise from a desire for safety was contained and more range bound. Along with international bonds, credit markets improved with tightening spreads. The only losers for the bond sector were long-duration Treasuries and commodities.

Change in Mood Reflected in Asset Markets
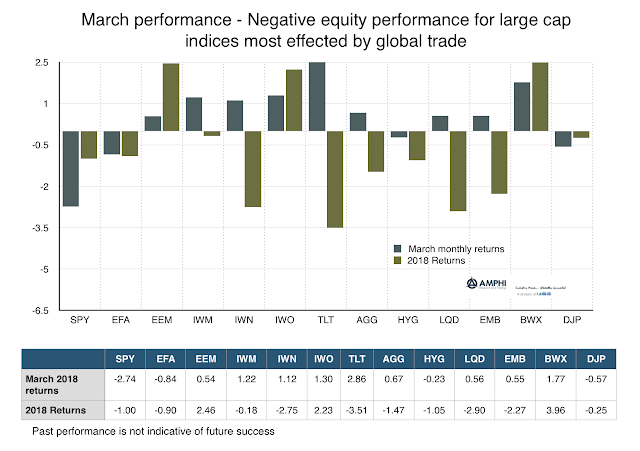
Markets have seen a significant change in economic sentiment over the first quarter of 2018. Market views have moved from euphoria concerning tax cuts and global growth, to the fear of a volatility shock, to a revised view of growth, and finally to growth fears under the concern that a trade war is around the corner. Overall, major assets, both equities and fixed income were negative for the quarter. Large cap firms that engage in global trade were hurt in March while bonds rallied as the safe asset. US small cap equities did better given their focus on domestic growth. Emerging markets gained on the dollar decline and the continued belief that EM markets have room for independent growth.