Category: Investments
Bending the return curve with rebalancing using trend-following
Rebalancing has become an essential tool for portfolio management. Nevertheless, market return patterns will affect the return impact of rebalancing. Regular rebalancing is a mean-reverting strategy. For example, suppose there is a simple 60/40 stock/bond portfolio. In that case, stronger stock performance will cause the allocation to deviate from the strategic allocation and lead to […]
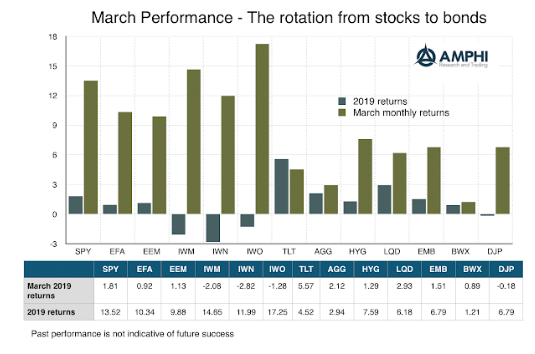
March – The big rotation from stocks to bonds
March was about asset class rotation from equity to bond demand with fixed income significantly out performing equities in March. Markets have moved from the January monetary euphoria to something more cautious and questioning. If the Fed potentially put all rate rises on hold for 2019 and the ECB is delaying a course on normalization, do they know something I don’t know?
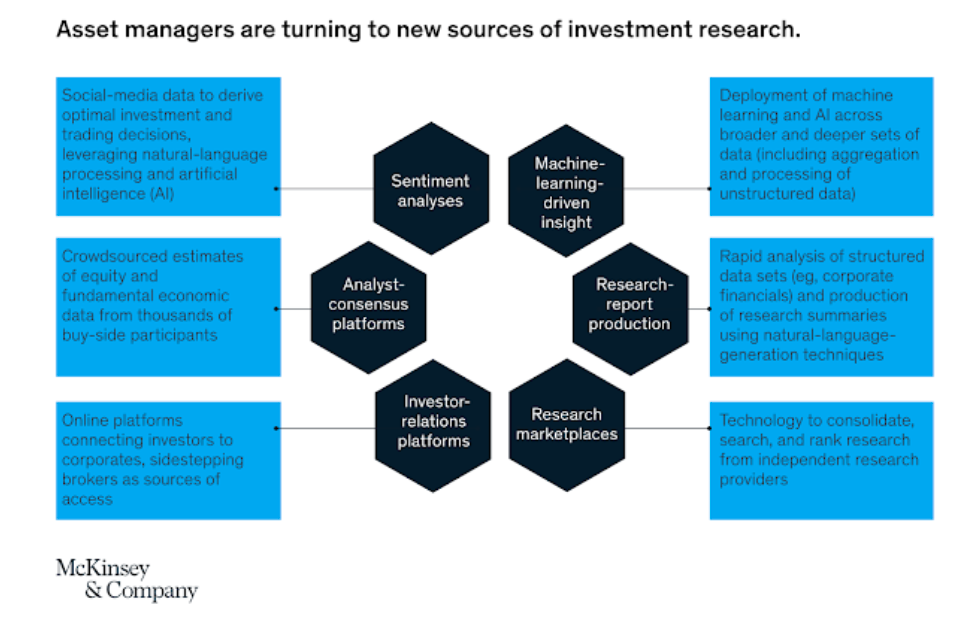
McKinsey & Co on investment management – Embracing advanced analytics only the beginning
A new research piece from McKinsey and Co focuses on the investment management industry, “Advanced Analytics in Asset Management: Beyond the Buzz”. This work is not cutting edge. It is straight forward advice that more analytics are being used in the distribution, back office, and the investment process, and investors are going to have to step-up their analytic game.
Follow Howard Marks – Know where you are in the business cycle
Farago provides a useful framework for describing the great short book Mastering the Markets by Howard Marks. The Marks approach is simple but often not given enough attention. Know where you are in the business and credit cycle and you will make better decisions and miss blow-ups.
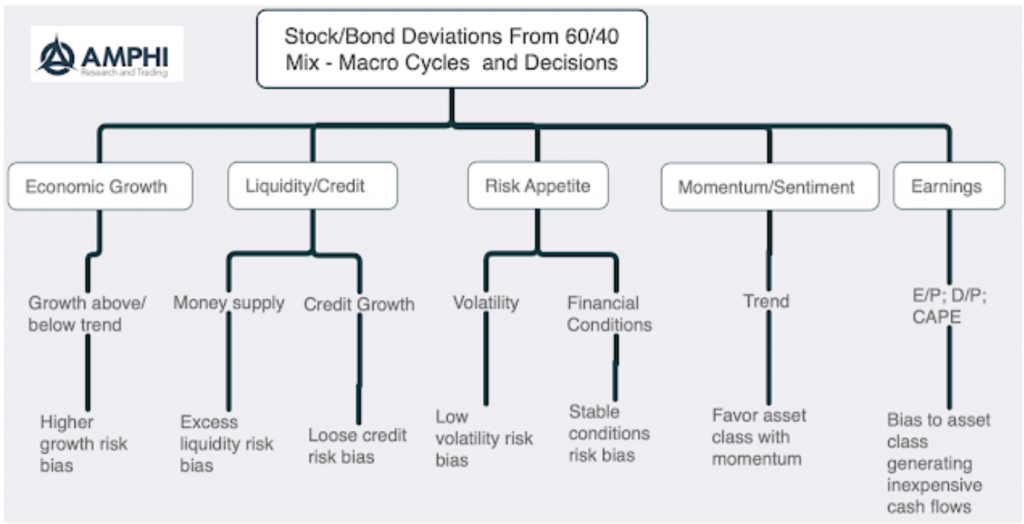
Stock Bond allocations – Using macro factors – Still be care with any equity overweight
The asset allocation decision for holding equities (risky asset) over bonds (safe asset) is inherently a macro decision. This macro decision is one of the most important asset allocation decisions given the large differential between stock and bond returns. The average annual difference is over 625 bps over the last 90 years in favor of stocks. However, bonds deliver lower volatility and reduce portfolio risk.
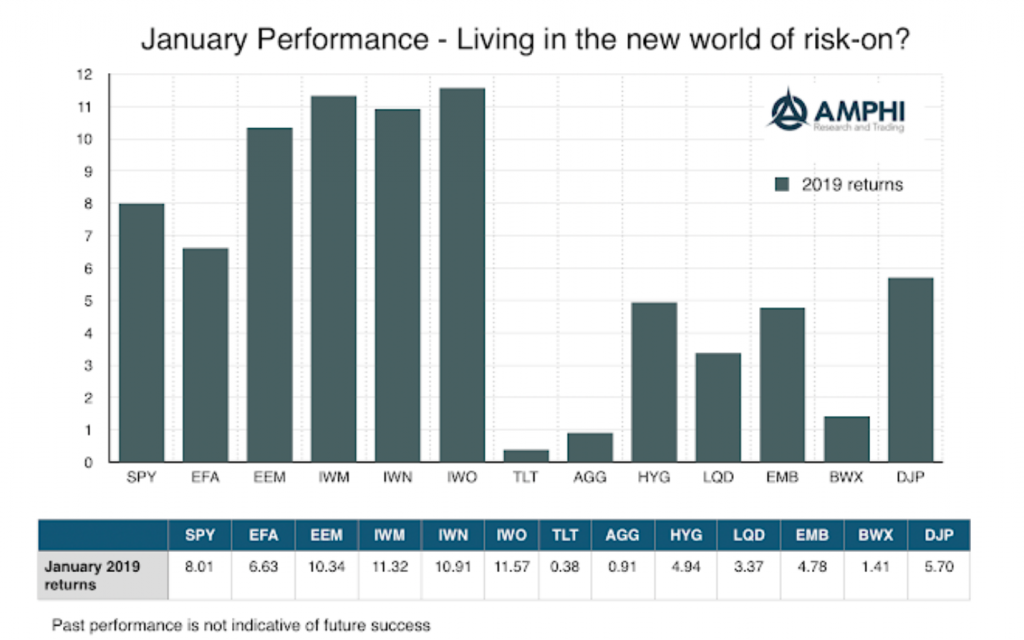
Living in the new world of risk-on? Be careful
It’s all about the “pause” from the “data dependent” Fed at the beginning of the month. It was reinforced with Chairman Powell comments at the end of the month. The data looked at by the Fed is based on macro fundamentals, but the perception is that the Fed is now financial asset data dependent.
The stock-bond mix and equity premia over time – Never oversell equity exposure
Many investors don’t appreciate that 2018 was highly abnormal for asset allocation. First, the annual excess return from holding equities is generally positive with the exception during recessions. 2018 was not a recession year. Yes, there was a slowdown in the fourth quarter, and growth expectations have slowed but the numbers do not suggest a recession at this point. Second, the likelihood that both stocks and bonds will be negative in a given year is very unusual. There has only been a 4.44% chance of this occurring over the last 90 years using the SPX and 10-year Treasury returns. It is highly unlikely that we will see a similar year in 2019. There have only been seven periods when the equity premium was negative for two or more years in a row.
If it keeps on rainin’ levee’s goin’ to break
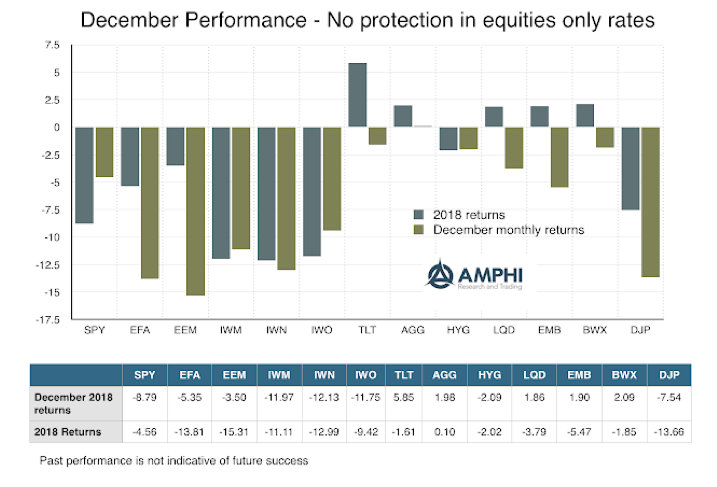
The levee broke in December with heavy selling of equities. Long duration Treasury bonds offered protection through its negative correlation with stock but there was little to make investors happy for the year. In some cases, the entire year’s return was swiped out in one month. Some analysts have suggested that this is the first time where almost all asset sectors and categories generated negative returns.
Yield Curve Impact on Asset Prices – Evidence Does Not Provide Simple Answers
Let’s just make things clear. There have not been many yield curve inversions, so analysts who want to study the behavior of asset prices during inversions have limited data. Yield curves may signal recessions which may also signal a decline in equities associated with slower growth, but the timing links are highly variable. The risk differs depending on how the question is asked.
November Performance – Bonds Say Environment Is Negative, Equities Don’t Agree
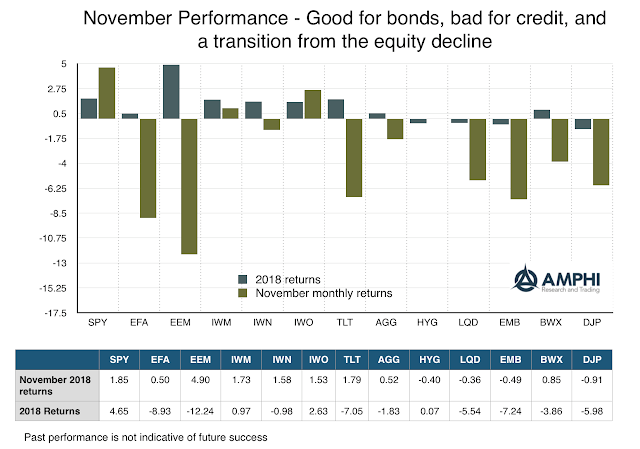
Last month nothing worked with all asset classes generating negative returns. October saw a shift in market sentiment toward risk-off behavior. Investors started to take loses and adjust to more defensive portfolios. Momentum was clearly negative early in November, but monthly returns are sending different signals with both US and global equities higher. Nevertheless, it is too early to make any statement that risk-taking is back on. Equity markets have come off lows but are not showing any trends. Credit ETFs declined sharply relative to Treasuries and long duration bonds gained on new fears of economic slowdown. Commodities declined on a sharp fall in energy prices.
The Illiquidity Dilemma: Navigating the Risks of Alternative Investments
If you have an asset that has an illiquidity premium, an optimizer will love it as a choice. An illiquidity premium is a dangerous area for investing. First, are you getting paid enough for illiquid? Second, is there a good way to measure illiquidity? Third, do you really know your liquidity needs?
What is PMI Telling Us about Stock/Bond Mix?
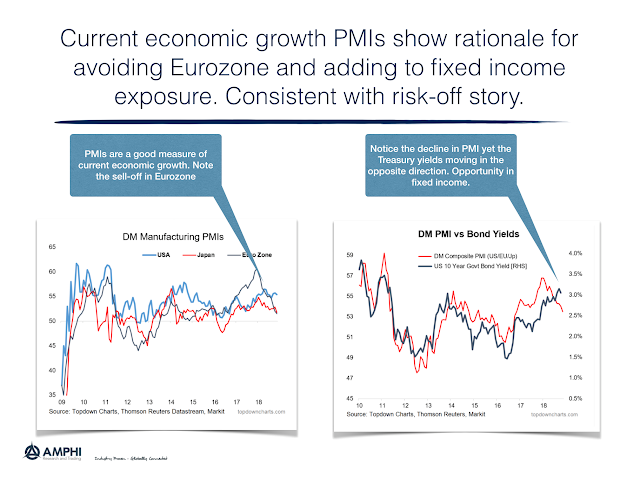
A big problem with macro fundamental investing is getting timely data on the economy and then translating that information to effective investment signals. Government issued data generally are out of date and old information for forward looking forecasts. Hence, there is greater value on macro data that is current and prospective.
Can You Improve on the 60/40 Stock/Bond Allocation Without Changing the 60/40 Allocation?
The classic 60/40 stock bond asset mix has proven to be a good core asset allocation. When in doubt, employing the simple 60/40 (SPY/AGG) asset mix as a base case has been an allocation that has performed well versus other diversification strategies. This allocation bias may be coming to an end.