Category: Uncategorized
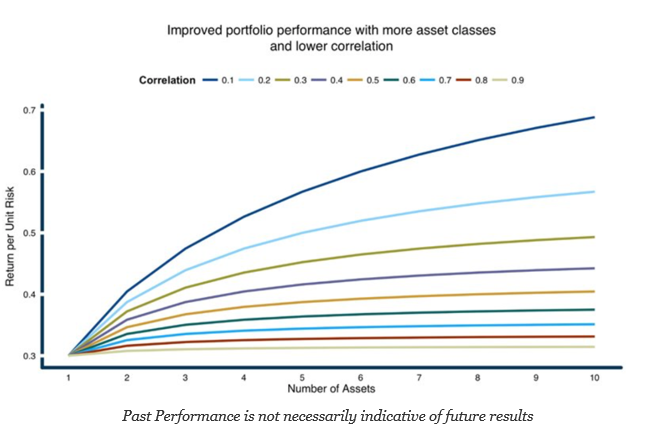
The Single Most Important Chart for Any Portfolio Manager or Investor – The Power of Diversification (Low Correlation)
Global diversified, multi-strategy, multi-asset class, portfolio of alt risk premiums, portfolios of traders – it does not matter what is the combination – Get more diversification and you will be a winner. When someone says “diversification is the only free lunch in finance”, the phrase may not truly resonate as well as a picture, and the picture above says it all. I can honestly say that for all of the educating in investments, this picture is not used enough.
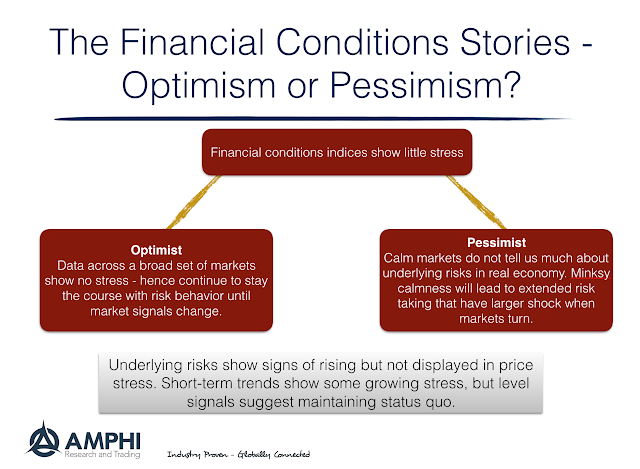
Financial Conditions are not Suggesting Stress – Be Optimistic?
The Office of Financial Research (OFR) Financial Stress Index is not showing any signs of a problem in financial markets albeit conditions worsened in February. It is notable that all sectors, credit, equity, funding, safe assets and volatility are closer to post Financial Crisis lows than the spikes in 2011 and 2016. Of course, the construction of the OFR stress index only includes financial spreads or price information and no fundamental information. Prices may lead economic financial stress and can be a cause of stress but it does not tell us about the drivers of financial pricing.

Give Me Some Metrics! Beware of those Metrics
I have been one of those “if you cannot measure it, you cannot manage it” types. Most quants are like this, but there are limits to measurement or trying to fit qualitative characteristics into a measure. Difficulty does not mean that attempts should not be tried. Most will admit that measurement is very useful in some areas of study but have to be more tempered in others. Jerry Muller, in his book The Tyranny of Metrics, explains the potential problems of a culture that focuses too deeply on measurement. This is a good counter to the always measured to manage crowd.

Global Macro Investors Need to know the Liquidity Environment – Global Liquidity Shortages and International Recessions
A focus of global macro investing is looking for general factors which can have an impact across markets and countries but are displayed slowly in cross-asset relationships. Macro traders watch closely global and local financial conditions such as monetary liquidity as good indicators for potential switches between risk-on and risk-off environment. They also look for changes in credit conditions as a signal of potential shocks across local financial markets.

Has Bitcoin Futures Saved Bitcoin Trading?
I have been studying the impact of futures on cash markets for decades, so I was very interested in the new short piece of research, “How Futures Trading Changed Bitcoin Prices” FRBSF Economic Letter 2018-12 May 7, 2018 that was published this week.

Mind the Gap – Simple Global Macro Relationships to Watch: Policy Differentials
Simple frameworks are effective with global macro investing. They set the tone for discussion and focus attention on the big issues. Look at the monetary/fiscal policy mix across countries to get a good feel for macro imbalances. These imbalances tell us something about current growth and future policy. Policy gaps are intended to close output gaps.

The Five “Whys” and Investment Management – Finding the Root Cause
I came across in some old papers the Toyota Industries solution to finding the root cause of problems, the 5 whys. It is a simple and useful tool. Sakichi Toyoda, the father of Toyota Industries, developed this technique to solve manufacturing problems, but it could easily be applied to any investment problem or due diligence issue. Ask why five times.

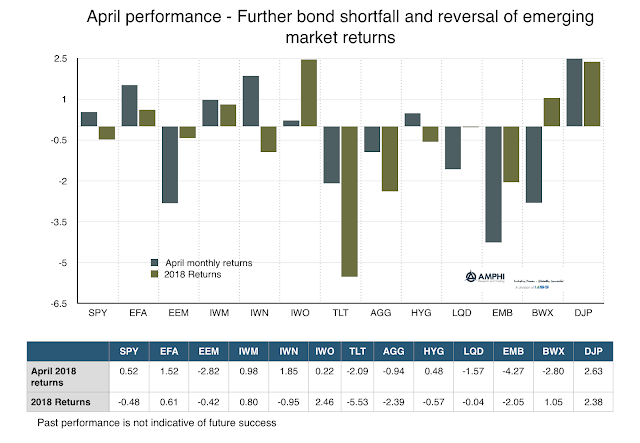
Some Sector Dispersion within Equities but Fixed Income Down Across the Board
There could be a desire to look for special patterns within April performance, but the only clear theme is the risk associated with holding bonds during a rising inflation expectation and tightening Fed environment. These issues spill-over to the dollar which affected affects the performance of international stocks.
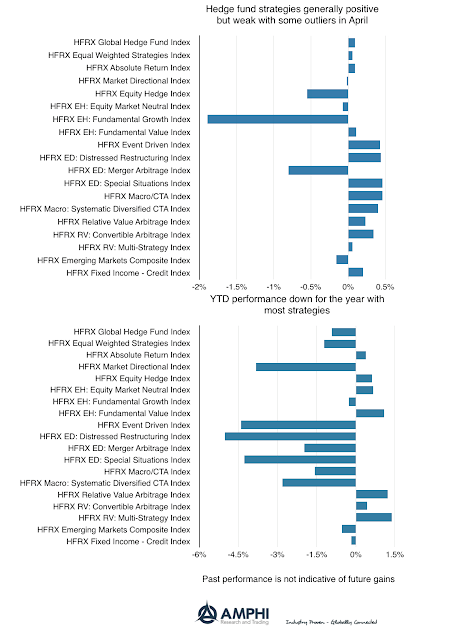
Hedge Fund Performance Positive, but Weak for April – Most YTD Returns Underwater
Most hedge fund strategies were positive for April, but the average return was less than 50 bps. There were two negative outlier strategies with fundamental growth and merger arbitrage. Generally, the higher monthly volatility and dispersion created a mixed environment for return generation. Year to date returns suggest that it has been a difficult four months for most managers with average loses much larger than the average for the winners and only 7/19 strategies producing positive returns.
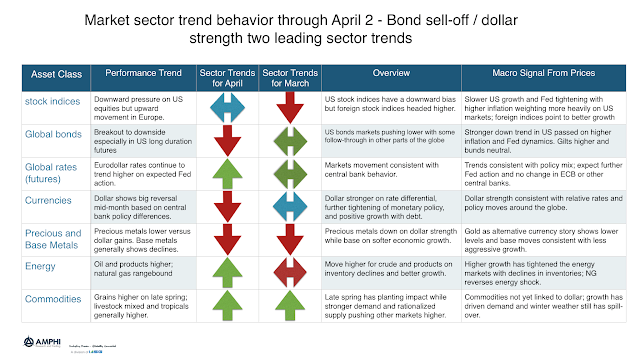
The Sell-Off of Bonds and Dollar Strengthening are the Two Leading Trends Expected for May
Our sector trend indicators, a combination of different trend length directions added across markets within a sector, show some significant changes from last month. This represents opportunities for May but also why some managers showed mixed performance for April.
Call It the Revenge of the Safe Asset – Bond Returns Decline
Call it the revenge of the safe asset. Bonds, especially on the long-end, continue to see a sell-off on a surge in inflation and the continued view that the Fed will not change their rate hiking program. This decline has been coupled with generally weaker performance in equities which has led to higher correlation between equity and bonds. The correlation measurement, which is backward-looking, still is negative between stock and bonds but it has risen from previous lows. This increase reduces the “safety” effect associated with bond diversification which has been the “free lunch” for many investors. This will be a growing problem if it continues. Investors will have to make portfolio diversification changes.

Improving Global Macro Investing – Monitor and Understand Financial Conditions both Globally and Locally
What is the most fundamental lesson learned for investors from the Financial Crisis of 2008? It is simple and in the name. We don’t call 2008 the Great Recession. We call it the Financial Crisis. Financial conditions matter more than what we have thought in the past. If money and credit is the oil that runs the engine of commerce, then financial conditions measure the efficiency of the wiring.

The Battle with Ambiguity – It is Constant within Investment Management
…Choices in situations of extreme uncertainty, which I termed “ambiguity”: sparse information, unprecedented or unfamiliar circumstances, lack of reliable frameworks for understanding processes, conflicting evidence of testimony, or contradictory opinions of experts….I felt that existing theories of appropriate behavior (“rational choice”) in these circumstances were inadequate, in fact misleading…