Category: Uncategorized
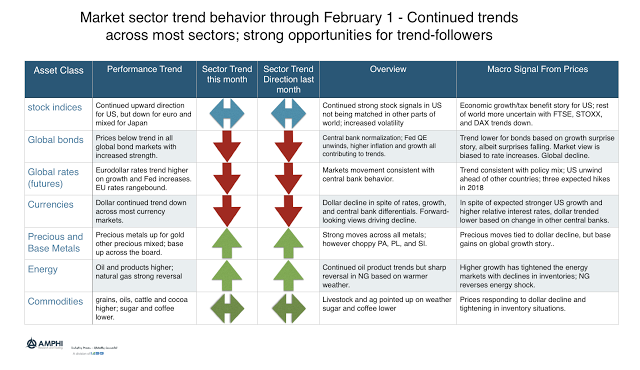
Trend in Markets – Short Bonds and Dollar, Long US Equities – Strength Continues going into New Month
January performance was a good start to the year for many trend-followers. Our sector trend measures suggest a good performance month that looks to continue into February. The fundamental themes concerning growth and inflation at the beginning of the year continue although with different levels of intensity.
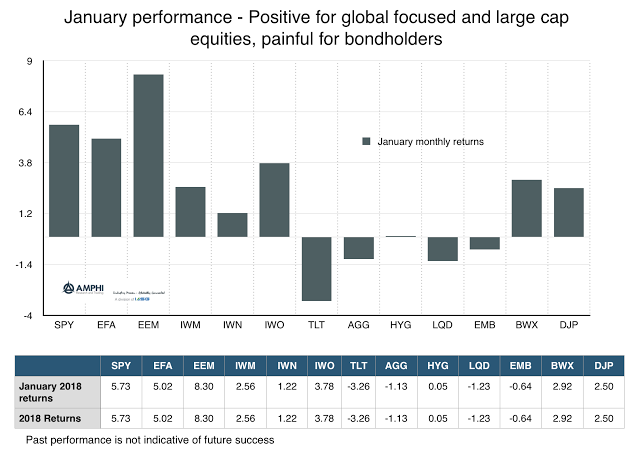
January Market Performance – An Extension of Growth and Inflation Themes
With continued euphoria about global growth and growing fears of inflation, the large cap and international stock investors saw strong gains while bondholders were hit with loses. Markets in January saw extremes in what were identified as the core themes for the year, growth plus inflation. Now, there may be stagflation holdouts, but growth indicators are still strongly positive albeit there are signs that the trends in positive economic surprises last quarter will be more tempered.
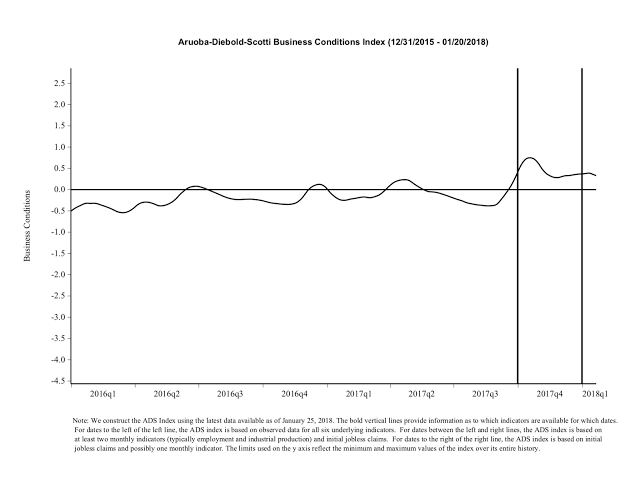
Philly Fed Business Conditions Index – Consistent With a Robust Market
The relationship between growth and equity market returns is not always direct. Equities can move higher because of an increase in earnings growth or from an increase in valuation. Market earnings should increase with economic activity but they may vary across the cycle. Similarly, the relationship between growth and nominal yields also can be variable albeit generally positive. Higher growth may lead to higher real rates, higher expected inflation or a change in monetary policy. The problem is that actual economic growth often has reporting delays so the link with market prices is mixed. The link between prices and fundamentals should focus on leading or forward-looking indicators.

Volatility and Price Bubbles – What You Need to Know Hard to Say There is a Strong Relationship, But Too Quiet is Not Good
No one wants to be the holding a bubble asset when the market breaks. It is not pretty given the potential for sharp corrections, but it is hard to say when it is time to leave the party. You could just say you don’t want to play the game, but the opportunity cost can be high because the time between bubbles begin and the market reverses can be measured in years. Additionally, with bubble language surrounding equity and bond markets as well as some real estate markets, the world could either be filled with bubbles or the term is being used so loosely that it does not have meaning.
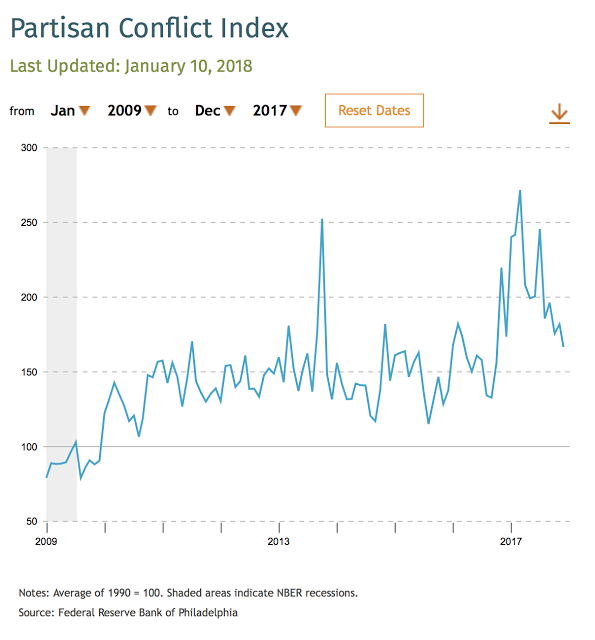
Philly Fed Partisan Conflict Index is Actually Down – Normalization May Be Good for Markets
As someone who is biased toward quantitative work, it has been difficult to judge the impact of political rhetoric and conflict on market behavior. Market uncertainty should increase when there are more partisan conflicts which should translate into higher market risk premiums. Nevertheless, if there is no measure of conflict, this idea cannot be put to a test.
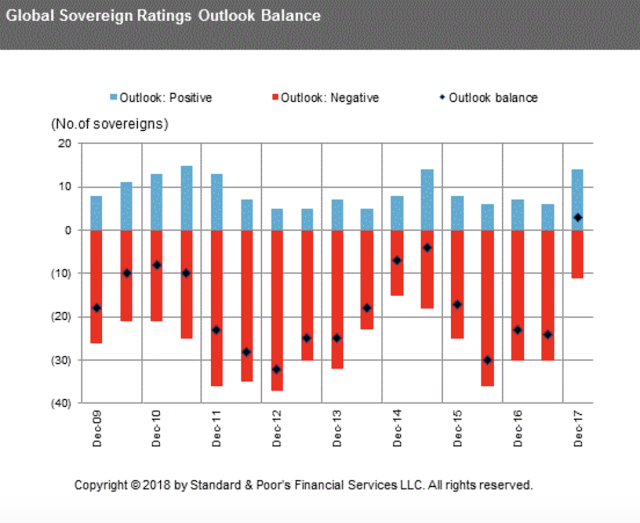
Best Sovereign Credit Period since the Financial Crisis – What a Surprise in Growth Will Do
A year ago the market was concerned about global credit risks. The sovereigns with a negative outlook were high and the number of positive outlooks was low, but that has changed in one year given the improvement in global growth. The number of negative outlooks is at post Financial Crisis lows, the positive outlooks are high and the balanced outlooks are positive for the first time. The balance has improved markedly across regions but especially in Europe and the Middle East. The chance of default risks has fallen given credit quality is improving.

Complexity Bias and Trend-following -We Have a Bias Towards Complexity Yet Simplicity Should Be Preferred.
Faced with two competing hypotheses, we are likely to choose the most complex one. That’s usually the option with the most assumptions and regressions. As a result, when we need to solve a problem, we may ignore simple solutions — thinking “that will never work” — and instead favor complex ones.
-Farnamstreetblog.com Complexity Bias: Why We Prefer Complicated to Simple
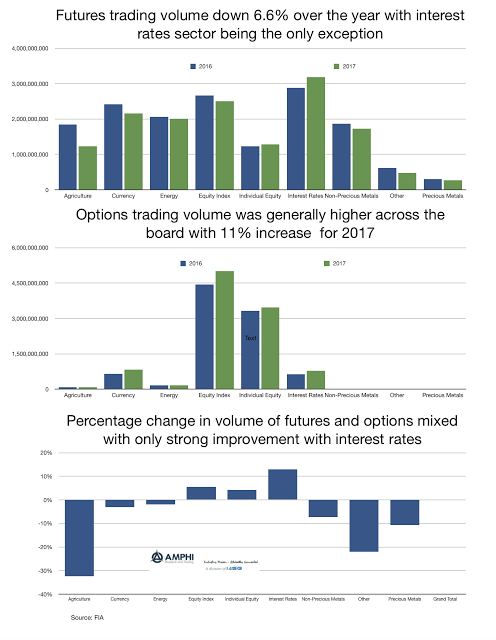
Volume in Futures and Options Flat Based on the Low Volatility in Many Markets – This Will Change in 2018
Global financial markets performed very well but you could not tell by looking at the volume of trading on futures exchanges around the world. The year-end numbers from the Futures Industry Association (FIA) show that futures trading volume was down over 6%. Options volume was up 11% and overall futures and options volume was flat for the year.

The Rate of Return on Everything – Everyone Needs to Save, But the Return on Wealth Over Growth is Volatile
The new paper, The Rate of Return on Everything, 1870-2015, a tremendously informative research piece on long-term rates of return also happens to address one of the key issues concerning the cause of inequality discussed by Thomas Piketty in his book Capital in the Twenty-First Century. Piketty draws the provocative conclusion that inequality grows over time because the rate of return on wealth is higher than the growth of GDP. Wealth accumulates to those that have it and not to those that try and ride the wave of GDP growth. Given the positive discrepancy between “r”, the return on wealth, and “g” the growth in GDP, the gap of inequality will only grow over time.

The Rate of Return on Everything – What Does This Tell Us About Safe Assets? They Are Not Safe
The new paper The Rate of Return on Everything, 1870-2015 is a mammoth piece of research on gathering information on rates of return back through history. It seems like such a simple issue but producing this work required painstaking and diligent focus on obscure databases. This work is not often rewarded in the economics profession yet has powerful use.

Understand the Incentive and You Understand the Analyst – Incentives Create Forecast Biases
We didn’t exactly believe your story, Miss O’Shaughnessy. We believed your 200 dollars. I mean, you paid us more than if you had been telling us the truth, and enough more to make it all right.
-The Maltese Falcon

La Nina Weather Pattern Will Bring Some “Fun” to Grain Markets – If Volatility and a Price Shock is Your Idea of Fun
There are seasonal weather patterns that will ebb and flow during the year bringing volatility to agricultural markets at regular times. However, the longer-term impact on supply can at times be limited. There is noise around production numbers but inventory can serve as a cushion.

“Likely” or “Probable” There is a Difference in the Language When you Start Talking About Recommendations in the New Year
I love this reformulated graph on the old work by Sherman Kent on the potential futility when using language to describe probabilities. There is a lot of ambiguity in the meaning of certain terms. One man’s doubt is not another’s “little chance” and one man’s “likely” is not another’s “probable”. If you use words, back them up with some numbers.