Category: Uncategorized

Equity Factor performance in 2019 – Clustering of Returns
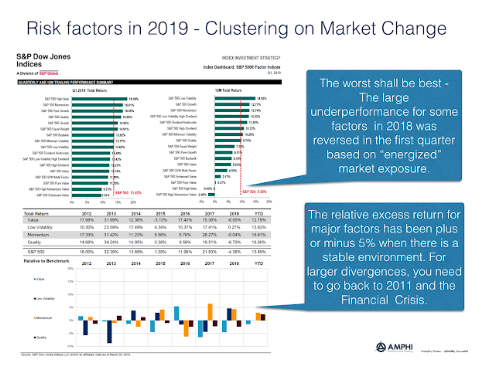
An analysis of the first quarter tells us a lot abut factor investing in the short-run. Foremost, the worst factors last year are the best for this year. Factor risks change with the market environment as shown through the global factor indices from S&P Dow Jones. Factor rotation occurs, but not clear that it is predictable. Factors effects also can be swamped by the impact of large macro events.
Bill Gross’ Alpha: How He Generated High Returns in Fixed Income Through Sector Risk Premium Allocation
Bill Gross has retired and there already has been research to see if he was the Warren Buffet of bonds. His fixed income track record over the long-run cannot be easily be matched, but a careful study of his portfolio suggests that his gains were generated differently than the classic stock-picker. He may have generated alpha but he did it the old fashioned way in fixed income, he took on more sector risk. See “Bill Gross’ Alpha: The King Versus the Oracle” by Richard Dewey and Aaron Brown.
The dispersion in hedge fund returns – Differences in style matter
All hedge funds are not created equal as the return box chart shows for the post Financial Crisis period. There is a significant amount of dispersion across hedge fund styles. Over the period 2009-2018, the difference between the best and worst hedge fund category is almost 7 percent after we account for global equities and bonds.
The Desire For Private Equity – Return And Yield; But Time May Be Running Out
The attraction to private equity and other less liquid alternatives is clear from the Guide to Alternatives by JP Morgan Asset Management. The return profile is much higher for private equity and debt funds than more liquid alternatives and global bonds; however, the dispersion in returns is multiples higher than what can be expected from other public categories.
Where are you getting diversification within alternatives?
All alternative investments and hedge funds are not created the same. There is significant dispersion in their correlations with global bonds and equities. Some are better at diversification and others are good for adding returns. A recent Guide to Alternatives from JP Morgan Asset Management provides long-term correlations for alternatives and hedge funds for the post Financial Crisis period.
Risk premia versus hedge funds – Worth a look
As we better understand the return generation process, we are able to dissect any set of money manager or hedge fund returns into its component parts. At a high level, any money manager can be divided into a set of risk factors or premia and alpha or skill. As a general conclusion, researchers have found that as investors get better at identifying risk factors, the size of alpha declines. We are able to attribute more returns to specific risks so the amount that is leftover as skill declines.

Market Tilt or Timing – Is there a difference in forecasting?
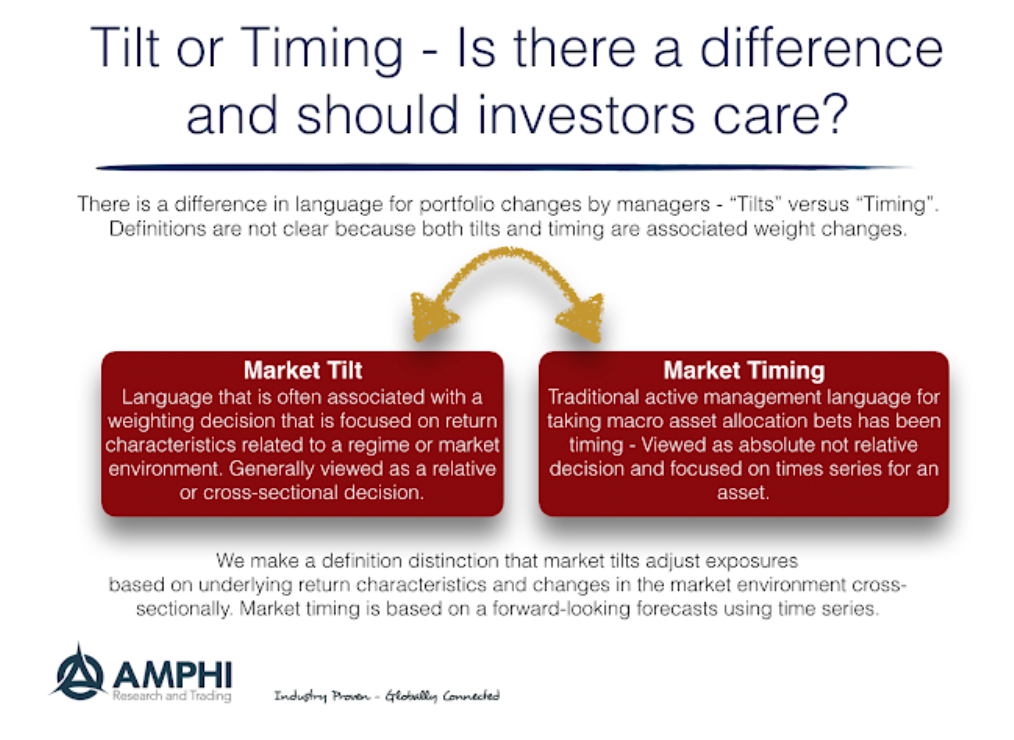
At a recent conference, I heard a large money manager say the following, “We do not market time, but we do take market tilts.” Unfortunately, no one was able to ask the manager to clarify the difference between tilts and timing. Aren’t they both forecasts?

Bracketing Fed Funds rates through a known set of model – Getting good probabilistic estimates
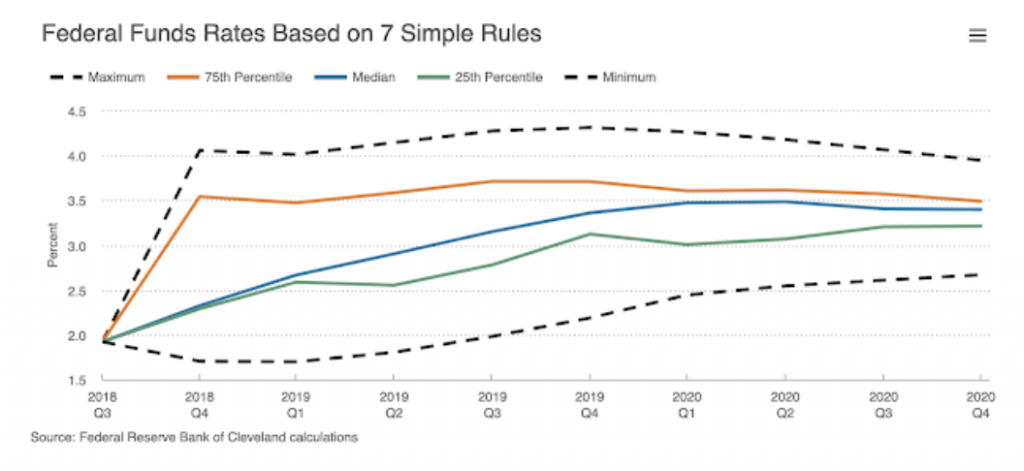
An ensemble approach to modeling can be an effective way to get a good idea of the consensus and differences in forecasts on futures moves in the Fed funds. This is an effective alternative to looking at Fed funds futures and options as a market estimate.
WYSIWYG, Hedge Funds, and Alternative Risk Premia – The Business of Product Marketing
WYSIWYG – “What You See Is What You Get”. This is a phase that has been applied in computing to describe the standard that what is on a computer screen should translate to what is on a printed page.
That’s crisis not correction alpha, you fool! Trend-following value is in simplicity
I discovered from reading an informative piece on managed futures and CTA’s from HedgeNordic magazine that trend-followers will produce “crisis alpha” but not “correction alpha”. A crisis is defined as a significant and extended downturn while a correction is short-term drawdown. Unfortunately, one man’s correction is another man’s crisis. All crises start and end as corrections.

Risk-on with trends – Hard to take the opposite side regardless of fundamentals
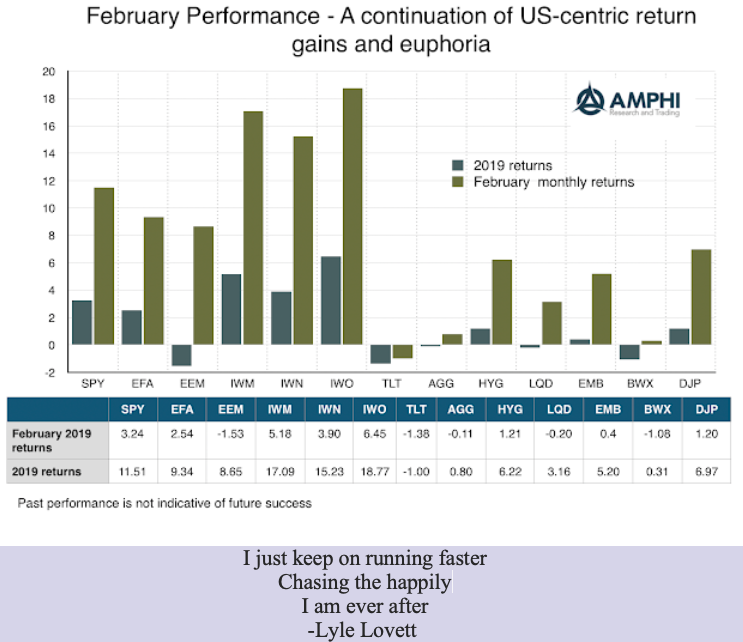
The trend is with risky US assets which is not what we saw in the fourth quarter of last year. The reasoning for risk-on is sound; equity volatility has been reversed and financial stress has fallen. These effects have dominated the US market and have had a stronger impact on riskier assets.
FX intervention – Analysis says central bank activity works
Many have held the view that central bank FX intervention is ineffective. It can be disruptive and have some temporary impact, but central banks cannot make currency markets do what they don’t want to do. Research using public data, a limited sample and mainly focused on floating exchange rate regimes, shows, at best, mixed value […]
Alternative risk premia overreaction in 2018 – Don’t fall for recency bias
What happened to alternative risk premia returns in 2018? This was a major discussion topic at a UBS risk premia conference last week. It was a difficult year. In fact, it was the worst performance year since 2008, and the decline for many strategies was a multiple standard deviation event. Yet, there is a good opportunity for investors who focus on the longer-run. Since the performance for many risk premia seemed unrelated to macro factors, there is strong potential for mean reversion to longer-term strong positive performance. To extrapolate recent performance as representative of history would be to fall into a recency bias.