Category: Uncategorized

MiFID and Managers as Return Factories – For Whom is it an Issue
MiFID II is coming with less than four months to go until the start date in January 2018, yet money mangers and hedge funds are scrabbling to find the right regulatory structure and the right way to manage the costs of the business. MiFID requires an unbundling of brokerage from research costs. Asset managers will either have to pay for research or bill clients. Many managers have yet to make or disclose their intentions on how research costs will be handled. A topic that has not been fully covered is an understanding of the cost generating the investment returns based on the process employed.

Sector Dispersion on the Rise – A Sign of Active Management on the Rise
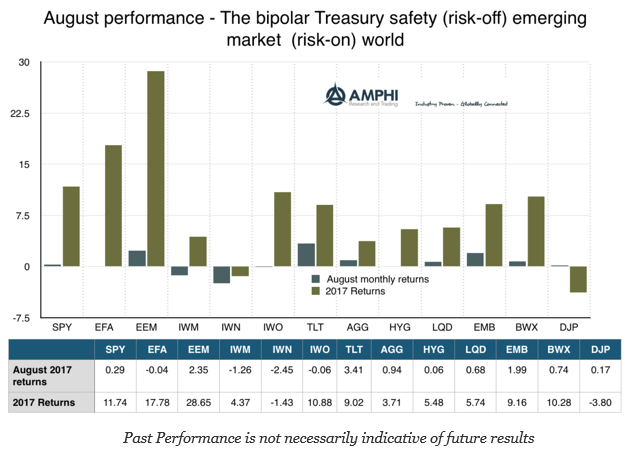
August showed growing dispersion across styles, sectors, countries, and bonds. For example, there was almost a 5% difference between holding the emerging market and value ETF’s (EEM-IWN) For sectors, there was an 8 percent differential between energy and technology (XLE – XLK) and a 3.5% difference in bonds between long-term Treasuries and high yield (TLT – HYG).

Positive Gains for Month on Bonds and Currencies – Strength to Continue
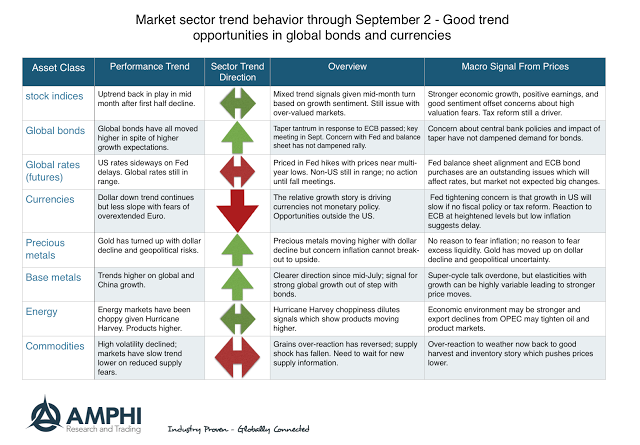
Many of our trend indicators were mixed coming into last month but continued gains in currencies and a strong bond rally positively contributed to performance for many CTA’s. The current trend indicators suggest continuation of these existing price moves. We take a representative sample of markets in a sector and count how many have up or down trends to form a sector estimate. The sector estimates can be strongly up or down or more neutral with a bias up or down as indicated by our arrows.

Agent-Based Finance and Investing – Exploiting more than Price is Important
The book, The End of Theory: Financial Crises, the Failure of Economics, and the Sweep of Human Interaction by Richard Bookstaber touches on the important idea that markets are driven by a diverse set of agents who have different objectives, levels of rationality, rules for making decision, and market power. The book makes a strong case for throwing out the existing theories that often rely on representative agents in order to more effectively explain the messy business of modeling financial markets.

August Performance – Living in a Bipolar World of Safety and EM Risk-Taking
Global returns in August were unusual because of the bipolar behavior across market sectors. The strong performance on the long-end of the Treasury curve coupled with the negative returns for small cap and value suggests there was a flight to safety by investors, yet one the best performing sectors was the riskier emerging markets sector.
Downside Analysis to the Next Level – Look at Partial Moments for an Edge
A close look at the VIX index shows a very skewed distribution as low levels push against a barrier. There is more risk that the VIX will rise versus fall. The same can be said for many other asset prices. Normality is out; non-normality with respect to distributions is in. The value of looking beyond standard deviation is all the more important in the current environment.

Big Events Often Capture Little Attention – Noble Group and Credit Default Swap Market Failure
There are events that do not capture headlines but can turn into a major market catalyst. Call it the twig snapping in the savannah. One event and the herd starts to move which may begin the stampede. Recent events in the credit default swap market could be one of these catalyst events. The herd may not react right away and this could turn out to be nothing, but we believe this is the type of catalyst that can change market perceptions.
Clear Thinking Requires an Open Mind – Why Models may be better than Discretion
The most difficult subjects can be explained to the most slow-witted man if he has not formed any idea of them already; but the simplest thing cannot be made clear to the most intelligent man if he is firmly persuaded that he already knows, without a shadow of a doubt, what is laid before him. – Leo Tolstoy

Carry and Trend Complements – Blend Premiums
Momentum works, whether structured as a times series or a cross-sectional strategy, across many asset classes. Carry strategies or risk premiums also work across a wide set of asset classes. More importantly, we know when these strategies do not work, or we at least know what are times to avoid. Also, when trend-following (time series momentum) does best, carry will likely under-perform and when carry is doing well, trend strategies are likely to under-perform. These are statistical relationships, but there are good narratives for why these two strategies are complements.

Risk Premium and Betas – What do you get from Quant Managers
Interest concerning alternative risk premiums has surged over the last few years. With this increased interest there has been questions with how to best access these premiums under real market conditions and not just measure them through existing asset classes. Investors want to know how to operationalize the theory and research.

More on Algorithm Aversion – It Can Be Eliminated if Given Some Choice
In spite of the strong growth of systematic trading, the problem of “algorithm aversion” is real and must be addressed. In many cases and in many disciplines, models do better than humans, but humans feel anxious with models and do not want to place decision-making in the hands of a machine. Even if a model does better at forecasting, individuals may still prefer the discretionary or non-alto approach if there is the perception that the model is imperfect. It seems as though individuals will like to have the optionality to choose an approach (model or discretion) as opposed to being locked into one choice. See our posts: “Algorithm aversion” and managed futures and Algorithm aversion or just a desire for low cost optionality

History, Linear Thinking, and Addressing Market Noise
To be a good investor, there needs to be a strong sense of history. To understand financial panic and crashes, the past crises have to be studied. To understand why opportunities sometimes persist or disappear, there needs to be an appreciation of past behavior and market structure. Nevertheless, history is not linear. The same investment mistakes are made as past lesson are often never learned. There is not really an arc of progress that can be bent or even followed. Progress in finance and in particular valuation can lurch forward or it can fall back based on the latest behavior of the crowd.

Kuhn and Systematic Research – Solving One Crisis at a Time
Thomas Kuhn, the science historian, developed big ideas like the paradigm shift in science, but his ideas can also work on the “smaller” ideas of finance research. The Kuhn cycle, which has been applied to the evolution of science, is a durable model for how real world research is conducted. It is an effective way to look at one critical part of the systematic research process. Quantitative research for many firms is broken into two parts:
1. A search for new models and strategies that are either uncorrelated with existing models or a new variation on an existing strategy theme, or
2. Maintenance of existing models through improvement and enhancements of existing parameters and frameworks.