Category: Uncategorized
Avoid Atheoretical Data Analysis – A Rule for any Data Specialist
The process of scientific discovery, even within finance, is essential. One approach to finding new strategies could be to generate observations and then provide explanations, such as an inductive approach. The other is to first form a theory and then test a hypothesis, deductive reasoning. Much of machine and statistical learning is inductive reasoning, where […]
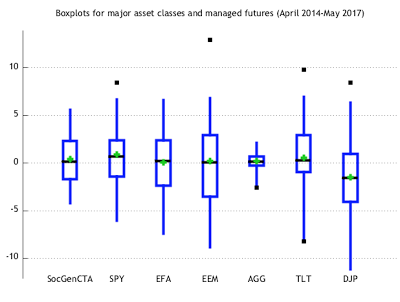
Looking at Asset Class Risk through Boxplots
Investors are so used to looking at standard deviation to define risk that they forget some easy exploratory data analysis tools that can be very helpful. The boxplot focuses on a greater description of the data through a simple display of a brand array of information. The box is formed by the first and third quartiles, the whiskers are 1.5 times the interquartile range, the green diamond is the average, and the black boxes are the outliers.
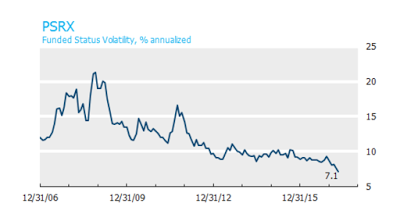
Pension Surplus Risk at all Time Lows
The Funded Status Volatility index (PSRX) from NISA is a useful tool for understanding pension risk exposures. It is an aggregate of the risks for pension based on the combination of assets and liabilities associated average allocations for the 100 largest pension funds as measured through public information and 10-k filings. The index, which represents $1 trillion in AUM, will move up and down with the volatility of all asset classes. Hence, falling equity and bond volatility as well as changes in the discount rates will translate into a falling PSRX index.
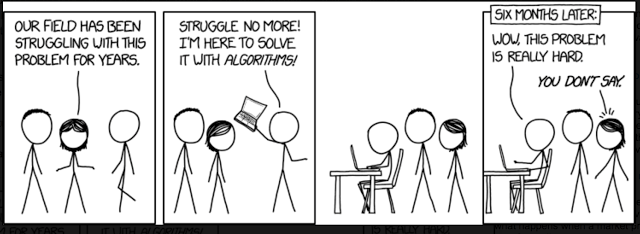
Quant Research and Managed Futures – Key Areas of Focus
Managed futures research is hard. This is especially the case in the quantitative area. There always are new models being tested by almost all managers, but finding a truly new model or process that adds value is truly difficult. Data mining is an issue.
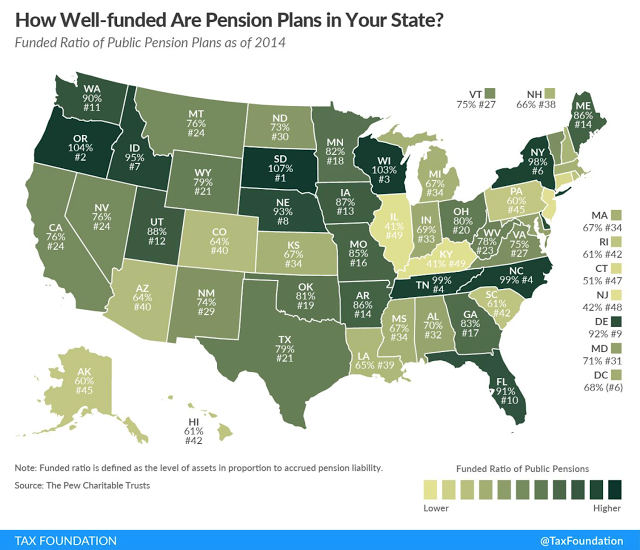
Who Needs Alternatives Like Managed Futures the Most? Underfunded State Pensions
The Tax Foundation map of state funding ratios for public pensions is very sobering. The amount of state under-funding is significant. These numbers are determined by the discounted expected liabilities relative to the assets held. To stay even with these ratios and assuming there is no surprise increase in liabilities, the states have to return the discount rate. These discount rates or expected returns seem unrealistically high.
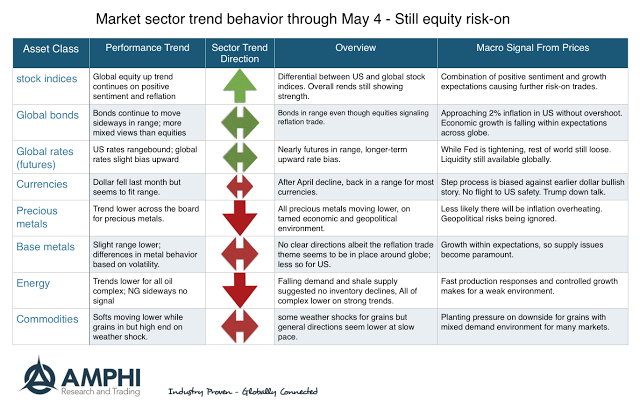
Market Trends for May – Some Developing Strength
Going into the month, there are good up trends in place with global equities and down trends in oil, precious metals, and selected commodities. What is interesting is the inconsistency across some markets sectors. The reflation risk-on trade is still apparent in the global equity indices, but we are not seeing strong evidence of bond sell-off or rally. Oil prices suggest both supply strength and demand weakness. Gold and precious metals are out of favor with long-only investors. The idea that we will have a dollar rally on Fed hikes seems misplaced and there is less risk-on demand for the US relative to the rest of the world.
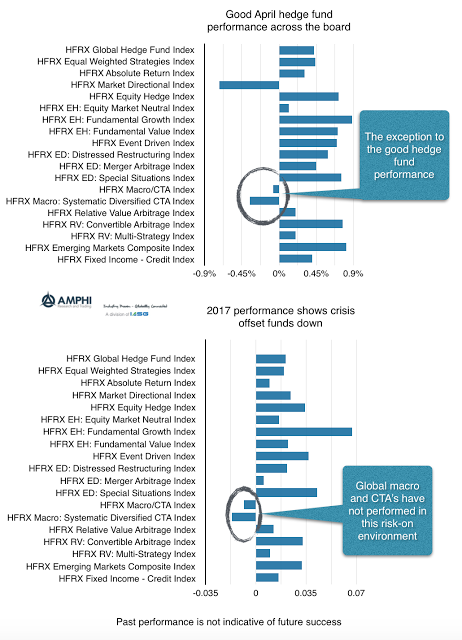
Hedge Fund Performance Consistent with Environment
No hedge fund strategy will make money all of the time. As the market and economic environment changes, the performance of different strategies will also change. Hedge fund factor exposures will be different based on the strategy employed by the manager. If you cannot predict the environment factor exposures, there is value with holding a diversified portfolio of hedge funds. April performance clearly shows the difference in strategy behavior.
Sector Analysis Supports the Risk-On Market Sentiment
The positive equity performance for April and the strong year-to-date returns show that the risk-on environment continues. What is noticeable is the switch to global and emerging market gains although this has been helped by the declining dollar which may have added about one percent to performance. Performance has rotated from the reflation trade in the US to a broader investment in global equities.

Fat-Tails Everywhere Even if Volatility is Low
I was reviewing an interesting research piece from Covenant Capital on kurtosis across different assets traded in the futures markets. They offer a spreadsheet tool that can allow anyone to find the number of fat-tailed occurrences relative to a normal distribution. The data show that there are fat-tails everywhere across all asset classes. We do […]
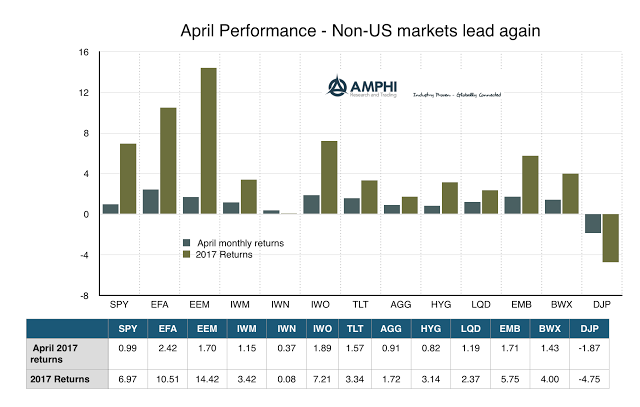
Strong Gains around the Globe for Risky Assets
It is a risk-on world with global equities (EFA) and emerging markets (EEM) now posting double digit gains for the year. A first round French election that was pointed less in the direction of Le Pen and a Trump presidency that does not seem as extreme as some pundits suggested has been coupled with global economic growth that is stronger than expected. The deflation trade may be further tempered in the US, but the threat of trade wars has diminished and the world economy is more focused on reality than dire economic scenarios.
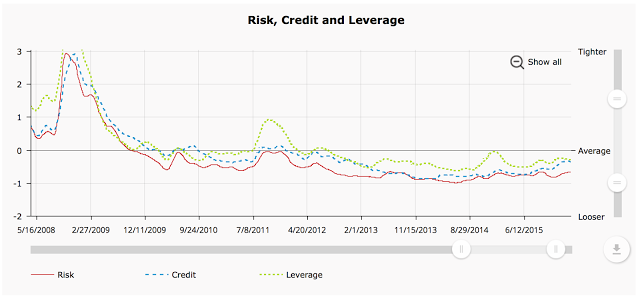
Always Check the Financial Conditions – Still Loose
There are many narratives for why equities or bonds will move higher, but a recurring theme is the financial conditions faced by investors. Financial conditions provide the tailwinds or headwinds to push asset class returns. These conditions tell us something about whether we will be transitioning between a risk-on and risk-off environment or whether we will be a crisis mode.

Determine What Goes Wrong with Your Investment Model
How do you know whether a model is broken? Or, how do you conduct a model review? There are many specific steps for any review but there are four major questions that have to be addressed that are separate from risk management. The key question of model efficacy should focus on forecasting skill and action. Does the model forecast correctly and is the model employed properly to make good decisions.
Preparing for Market Risk – Stay Diversified Across Asset Classes, Factors, and Strategies
You get recessions, you have stock market declines. If you don’t understand that’s going to happen, then you’re not ready – you won’t do well in the markets. If you go to Minnesota in January, you should know that it’s gonna be cold. You don’t panic when the thermometer falls below zero.
-Peter Lynch