Archives
Stupidity – Not acting on what is right in front of you
I defined stupidity as overlooking or dismissing conspicuously crucial information. – Adam Robinson
That definition seems obvious, but there has been deeper research studying how to define stupidity. Of course, this research was published in an academic journal called, Intelligence.
Nonetheless, it seems that one of the key ways to generate success in investment management is to just not do stupid things. Cut the stupidity and you will be more likely be a success. Unfortunately that is easier said than done. Stupidity is all around us. We are not just talking about behavior biases but rather the issue associated with a lack of good sense or judgment. Of course, behavioral biases and stupidity do intersect. The attempt to employ mental shortcuts will lead to stupidity.
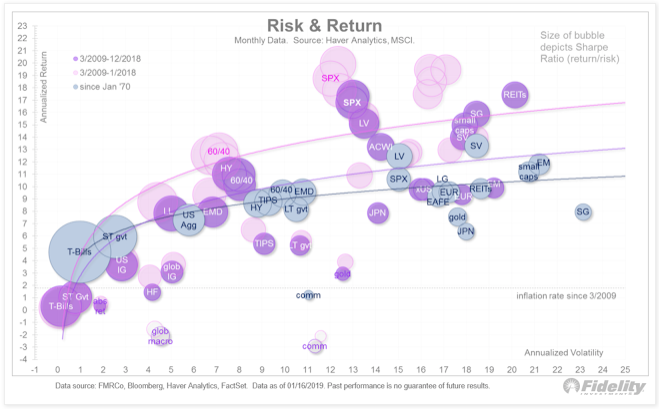
The Efficient Frontier – Not a Line but Cloudy Dream
This is a very interesting chart of the efficient frontier from Fidelity for a number of reasons. On one level the return to risk locations for different asset classes are relatively stable, but there has been a mean reversion of returns during the fourth quarter that is pulling return to risk ratios back to long-term averages. Excess returns by definition cannot last forever. The fourth quarter was a correction to the long run and by the evidence in January perhaps an over-reaction.
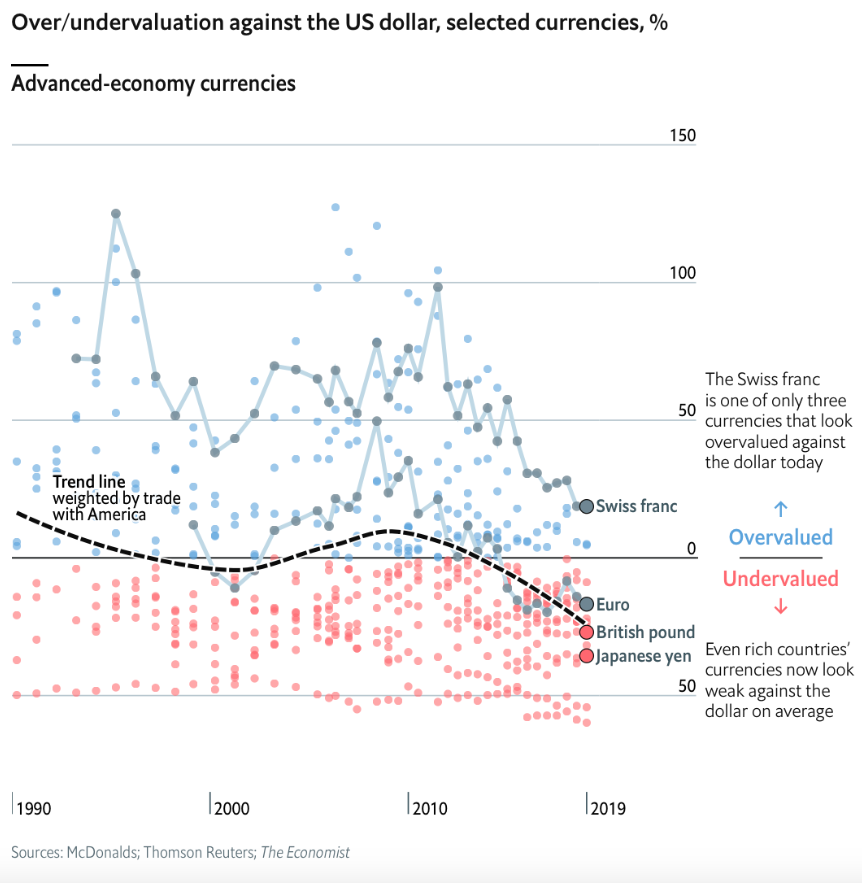
Dollar down – A big trade for 2019?
What was keeping the dollar moving higher? A simple difference in monetary policy has been a key driver. With the Fed tightening through raising rates and engaging in QT, the reserve currency provider was out of step with the rest of the world. However, recent comments by Fed Chairman Powell and other Fed bank presidents have changed policy expectations.
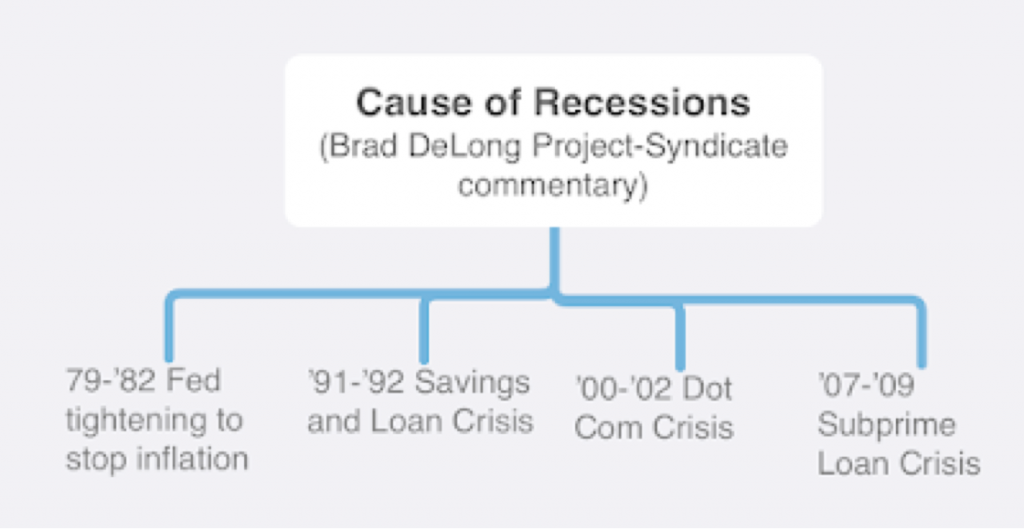
What will be the cause of the next recession?
There has been increased market talk about the next recession. Many are predicting it will occur this year albeit the dispersion of views is wide. To do a proper assessment for the cause of the next recession investors should go back to the causes of past recessions. This one will be different, but we should assume there will be common features with the past.
That marginal piece of information – What do you need to change you views?
Most data are confirming. New economic data are always occurring, but these announcements just reinforce what we already know. First, a lot of economic data moves together, so there is limited added or marginal information. Second, there is a bias with investors that they look for or see confirming information to their existing view.
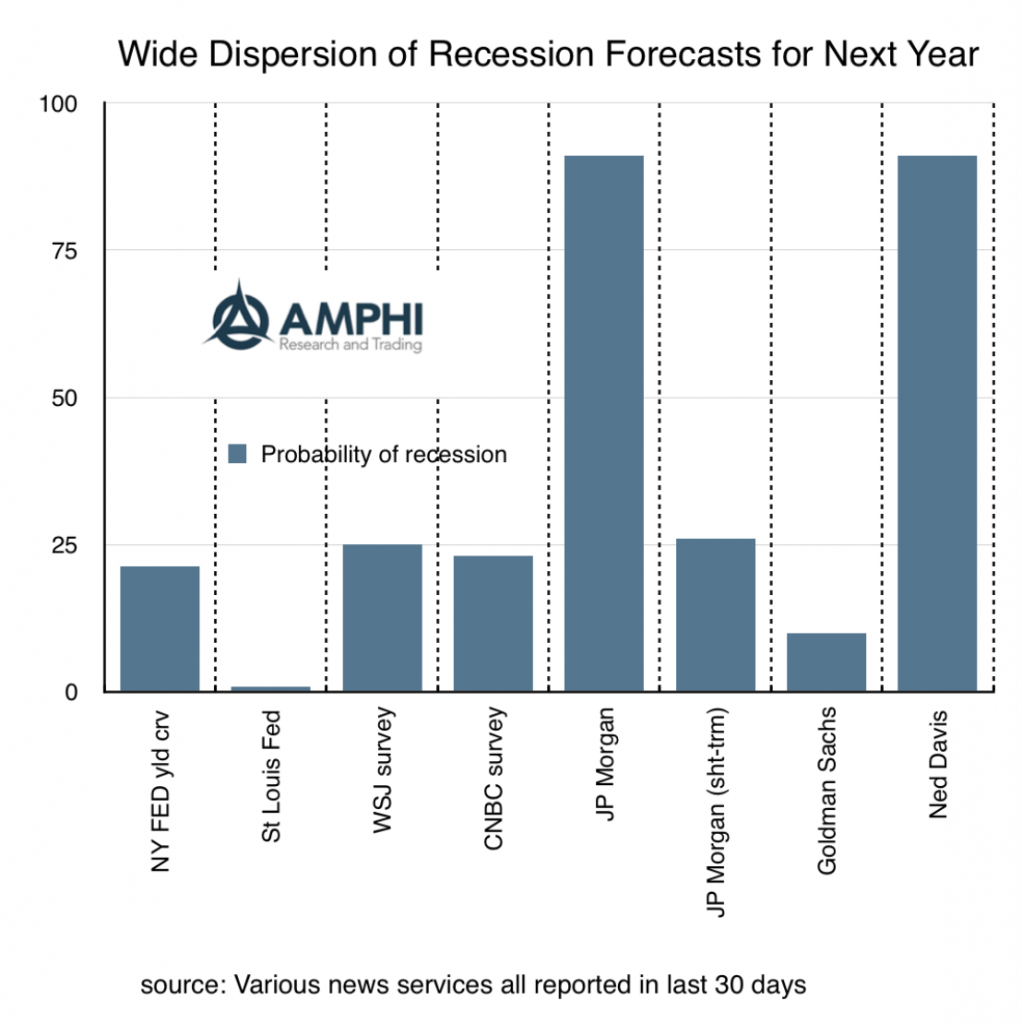
Recession probabilities – There is no consensus
What is the chance of a recession this year? Many have tried to build systematic models to give a probability number. This has been a good advancement in thinking about macro forecasting, but the variability of forecast is unusually wide. Different inputs will give different probabilities and there is no consensus on what should be the right inputs.
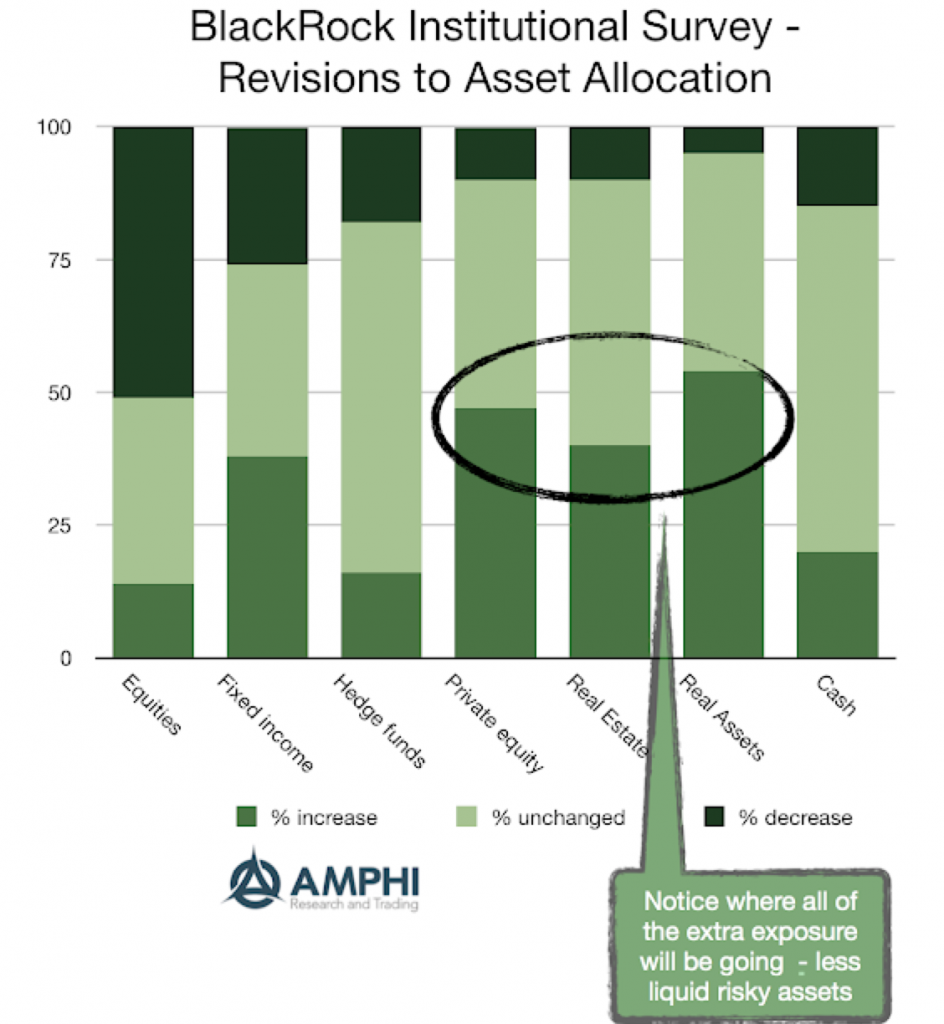
Where are institutional investors going to put their money? Not what you think
It was a tough year for money managers. All asset classes underperformed cash and most were negative for the year. Equities were a return disaster for December. Hedge funds did not do well for the year. So what will investors do?
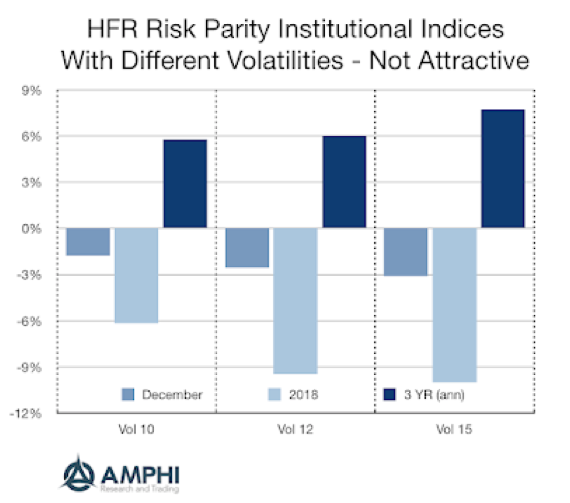
Risk Parity – A tough year for this diversification strategy
Risk parity was thought of as a portfolio strategy that would protect investors buffeted with uncertainty. Don’t think about dollar allocations, but risk allocations; it is a better way to manage a portfolio. Unfortunately, theory does not always work in practice. Using a simple benchmark of the average return for mutual funds with 50-70% equity allocation would have had slightly better returns than the 10% risk parity index and would have done much better than the higher vol indices in 2018.
What are shadow interest rates telling us?
We cannot forget that the zero bound on interest rates caused distortions in market price signals. Now in the US rates are above the zero bound so it seems like the concept of a shadow rate is not important; however, it is still relevant for many other central banks and it provides a good measure of where we have come over the last few years. Using the shadow rate as a historic measure of relative tightening, we can say that the Fed has actually been on a tightening policy since the end of quantitative easing.
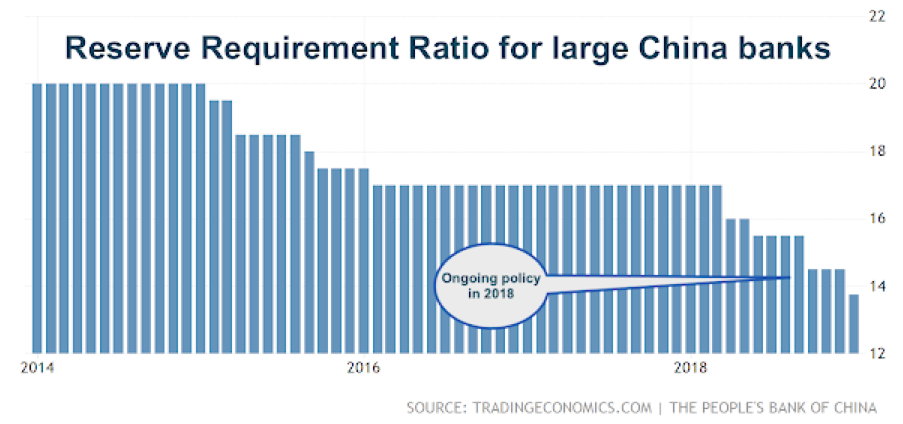
Just as important as Powell Put – China monetary action; PBOC on the move
One of our major themes for 2019 is that investors should more closely track monetary policy developments in China. The reasons are simple: the economy is big, its trade impact is global, and the PBOC at times has followed a monetary policy at odds with the Fed and ECB.
Facts and Stats – Some facts are interesting but not useful
The end of the year is usually filled with reviews and facts about what happened and speculation on what may happen in the future, yet investors can be cluttered with too many facts. Some facts can be very interesting and great for conversations, but that does not mean they are useful for plotting a course for 2019.
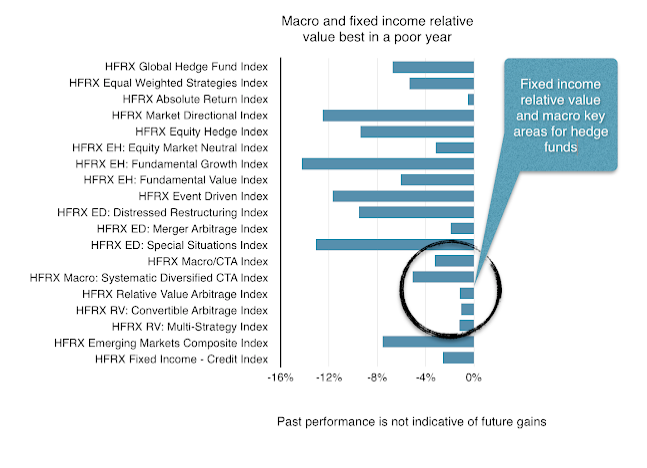
Hedge fund performance – Not great for those looking for absolute performance
The only hedge fund sectors that made significant returns in December were global macro and systematic CTAs. These are the divergence strategies that are supposed to generate returns when there are market dislocations. Macro and systematic managers, through casting a wide net across asset classes and going both long and short, should find opportunities when there are significant dislocations. The remaining hedge fund strategies lost money, but significantly less than the exposure to market beta. It was not a successful month for most hedge funds, but it was not as bad as exposure to equity beta. However, long duration Treasuries proved to be a better hedge.

Powell Put in place after AEA comments
Every Fed Chairman has their own variation on the market put strategy; Greenspan, Bernanke, Yellen and now Powell. We can call this new one the “everything on the table” put strategy where the guidance of yesterday tells us nothing of what might happen tomorrow. This may be a reluctant put. Powell may have tried to stay the course for tightening, but a bear market can change the mind of many a well-intentioned central banker.