Archives
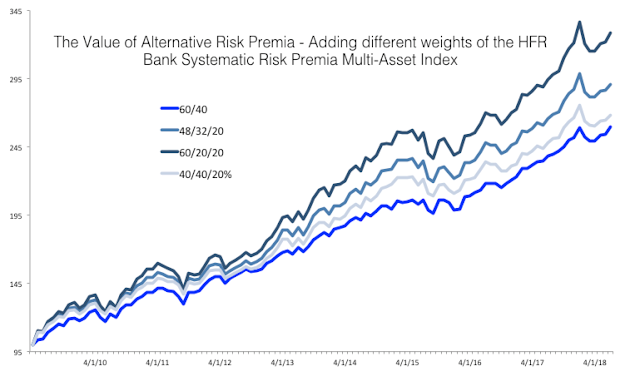
Simple Alternative Risk Premia (ARP) Allocation – You Get Value
Investments in alternative risk premia (ARP) are way to access the important building blocks for returns and generate return streams that will not be highly correlated with market beta exposures. Through factors and styles like value, carry, momentum, and volatility, investors can generate unique return streams relative to asset class betas. To show the value of alternative risk premia, we have taken a broad based index constructed from HFR through bank swap products and compared against a standard 60/40 stock/bond index. The HFR index is new and represents only a portion of the growing ARP market and may not include the largest banks. Still, it may provide some insight on what realistic value can be added through investing in a portfolio of risk premia.
Don’t Worry About Investment Consultant Advice On Manager Performance – It Does Not Exist
How many times have you gone to a pension fund or endowment and heard the phrase, “You will have to check with my consultant”, or “If my consultant hasn’t approved you, I will not invest”. Pension consultants are powerful in the money management industry. Without their blessing, it is hard to grow an institutional money management business. There is the assumption by many that they have special investment powers that allow them to conduct due diligence and ferret information on managers that cannot be achieved my most others.
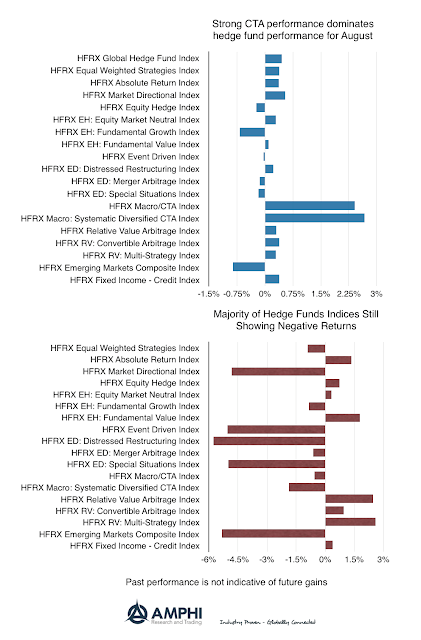
CTAs Show Strong Monthly Returns, But Hedge Funds In General Have Not Found Their Edge This Year
Whether, large-caps, small-caps, growth or value as measured by the major stock index benchmarks, US stocks markets are having a good year, but you would not know it if you saw August or year-to-date hedge fund style performance. Many hedge fund managers seem to have missed the big equity moves and not generated alpha. We find this especially odd since market dispersion and correlation numbers within indices show that there should have been a significant number of unique opportunities as measured by S&P Dow Jones Indices.
The New Era of “Sudden Stops” and Emerging Markets
The 1990’s were filled with emerging market failures through “sudden stops” – a sharp reversal of capital flows which led to declines in currencies, large increases in local interest rates, and sharp declines in equity market. Countries hit a funding wall.
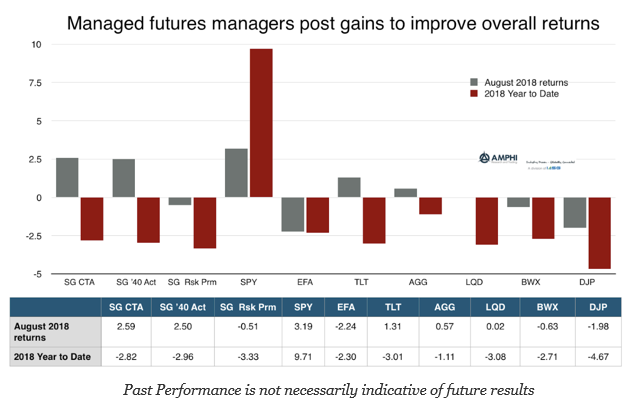
Good Month for Managed Futures – Finding Opportunities in Financial Markets
Managed futures showed good returns for August with gains in both stock indices and bonds. Given size and liquidity, as equity and global bonds goes, so goes CTA performance; however, there were also gains in selling grain markets and taking advantage of shorter-term trends in the energy sector. Other CTA indices like the BTOP50 also showed strong gains for August and similar year to date numbers at -2.66 percent. The SG alternative risk premia was down slightly for the month.

Trend Environment Mixed – Limited Directional Moves Beyond US Equities
Using a combination of short, intermediate, and long-term trends across the major markets within a sector, we make judgments on potential trend behavior for the coming month. Our signals are surprisingly mixed as we move into the post-Labor Day period. While there are some upward and downward biased sectors, all seem more range bound with no consistency between short and longer-term trends. This was after a good trading month in August.
Risk-On In US, But Not For The Rest Of The World
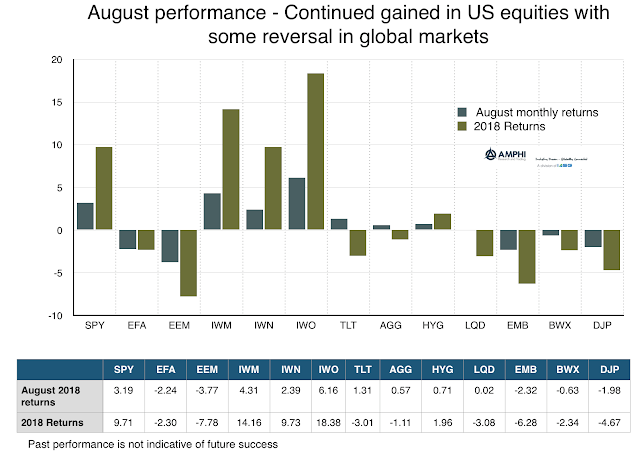
Call it the pain of international diversification for 2018. With a significant divergence between US and international equities, the cost with holding DM and EM stocks has been significant. The differential between EM and US growth indices is over 25%. August just added to this different with fears of sudden stops in risky EM countries. Turkey and Argentina have both showed that credit flows can change quickly in a sensitive macro environment.
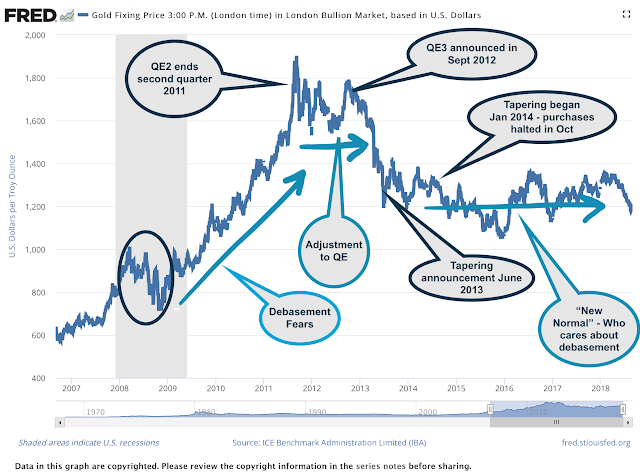
Gold – The Asset We Often Use To Project Fear and Optimism
Gold is hard to understand as an investment. Sometimes it behaves like an inflation hedge but at other times it does not. Sometimes it responds to the real cost of funds, and sometime it does not. It can serve as a safe asset, yet it has sold-off in a crisis. It can be the uncorrelated asset of frustration, but a longer examination tells us about investment deep investor expectations. Gold, over the last decade, can be viewed through three major themes.
The Two Disconnects of 2018 – Market Behavior Versus Politics and US Versus International Equities
What can be called the twin disconnects of 2018 have continued this summer. There is the disconnect between market and political behavior. If you read the newspaper headlines, you would think there is government confidence crisis in the US, yet if you plot market activity, any investor would suggest the economy is in great shape. There is also the disconnect between US market activity and global market behavior. 2018 is shaping up to be a great year especially for small cap and growth benchmarks that are both up double digits with August again showing strong performance. Global and emerging markets, both equities and bonds, are sickly.
Judgment and Experience – A Recipe for Success for Any Strategy
Each situation requires a balancing derived from judgment and arising from experience, skills acquired by learning from the past and training for the future.
Dollar Doom Loop – Why A Stronger Dollar Today Means More Financial Trouble Tomorrow
The Financial Times suggested that there is a “Dollar Doom Loop” facing the Fed. Perhaps a little dramatic with the “doom loop” analogy, but not as bad as “death spirals” or “Wile E. Coyote moments”, this story sets the tone for what may be one of the biggest problems not being looked at by most investors. Risk is really volatility or price moves times the exposure to the price change. As the dollar denominated global debt exposure increases, there will be more global risk for any change in rates.
The “3 By 5 Card” On What Investors Need To Know About Yield Curve Flattering
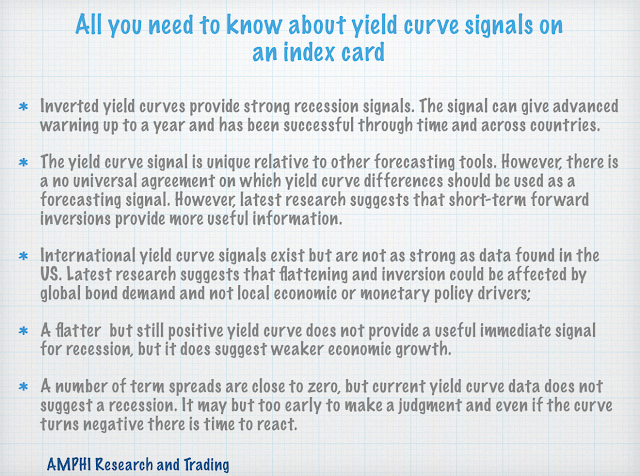
There has been a growing focus on the yield curve and the threat of recession. If you don’t believe me, look at the number of web searches. The interest is high, but all that you need to know can be placed on a 3×5 card. Investor interest in the shape of the yield curve should be high, but that does not mean a recession is around the corner.
Economic Data Sausage-Making And Why Prices Are Primal
Most top-down and global macro managers follow all of the macro data announced each day. They will compare data across time and countries to understand relative economic performance, but when they go back to basics to understand how data are constructed, they will usually get a very uneasy feeling. How much noise is in this data?