Archives

Portfolio Trust in Mean Reversion Not Momentum – The Contradiction of Investing in Trend-Followers
Most trend-follower will say that they are “non-predictive”. While I think this is true in the sense they do not form forecasts or expectations, trend-following is also based on the prediction that the price direction through some set of price weighting from yesterdays and today will continue into tomorrow. Trend-followers do not try and forecast expected returns rather they extract signals from past data under the assumption that price moves will have memory of at least direction. These managers find trends across a large diverse set of markets and then invest long or short based on these trends. If the markets are moving higher, they are a buyers, and if price move lower they are sellers. Buy high under the assumption that prices will move higher and sell low under the view that prices will move lower.

Stock-Bond Correlation – An Inflation Regime Change Will Push It Higher
A recurring global macro theme has been how investors should think about stock bond correlation. The negative correlation between stocks and bonds has been the single best diversification provider for any portfolio. There are very few alternative investments that have offered the same amount of diversification and provided a significant amount of alpha. This simple diversification is why variations on the 60/40 stock/bond portfolio mix have been such winners since the Financial Crisis. But times change, or more specifically, regimes change.

Oh My Bonds
“Oh my god, the unemployment rate is below the natural rates, sell your bonds!”
This has been the usual bond market reaction for the last few decades, but the world has changed. There may be good reasons to sell bonds, but a low unemployment rate may not be the main driver. Investors need to kill off the idea of the natural rate of unemployment or at least modify their views. That does not mean that bonds will not react to low unemployment rates, but the current sensitivity is significantly different than what we have seen in the past.

If You Want to Understand Overall Credit Spreads, You Have to Have Both a Macro and Micro View
If you want to understand overall credit spreads you have to have both a macro and a micro view. The macro view looks at the business cycle and the chance of default for risky assets based on economic growth. The micro view looks at the credit supply coming to market, the demand for loanable funds at any time, and the structure of deals. The macro focuses on credit risk expectations and the micro will be more centered on the flow of funds. A macro-micro framework helps focus our interest in actual and perceived credit dislocations.

Expressing Trend Bets Through Futures or Option – The Problem of More Moving Parts
The choice between using futures versus employing options for a trend-following program is worth reviewing after the recent market events. Would trend-followers who used options have done better than those who expressed their directional bets with futures? The key to this answer is whether the trend-follower had a view on volatility.

Quants and Uncertainty – Post-February Thinking
As far as the laws of mathematics refer to reality, they are not certain; and as far as they are certain, they do not refer to reality. -Albert Einstein

Buying Commodities a Play on China Growth As Well As Inflation
We have previously posted the relationship between global growth and commodity returns as measured by the leading index (BCOM). Global growth above 3% is a good tailwind for overall commodity demand that will push prices higher.

Commodity Driven By Global Growth – Above 3% Growth and Prices Push Higher
Commodities are an effective way to hedge against inflation, but it can also be viewed as a simple way to play the global growth story. The average annual total return for the Bloomberg BCOM index (formerly the DJUBS commodity index) since 1992 has been 1.37% but if we look at returns when global growth is above 3%, the average annual return was 10.91%.

Looking Back Over Commodities for the Last Ten to Fifteen Years – Currently in Normalization Phase
Commodities have not behaved like other asset classes since the Financial Crisis. In spite of all the monetary easing and the lowering of interest rates, commodities have marched to their own drummer, or, put differently, the commodity cycle has been independent of the business, financial, or monetary cycles. It is because of this difference that commodity exposure may look more attractive than traditional assets.
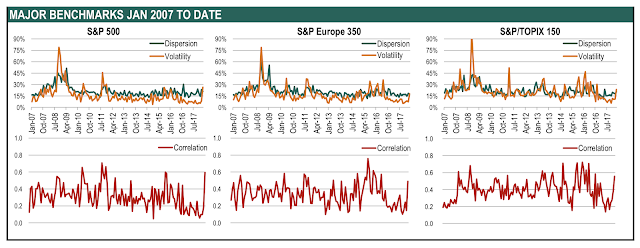
Correlation Up – A Beta Not Alpha World For Now
We follow the dispersion, volatility and correlation indices generated by Standard & Poor’s which show intra-index stock behavior over time. When the correlation across stocks within in an index is high, there is a clear sign that the market is facing a macro shock. Performance should be biased toward beta risks. Fund returns will be driven by their beta exposure and timing skill not by their stock-picking skill. When correlation is low across stocks within an index, we can say it is a stock picker’s environment because skill-based traders will be rewarded for exploiting differentiation across firms. This lower correlation will generate more dispersion in returns if there is additional volatility.

Preqin Investor Survey – What Are The Demands For Hedge Funds?
The recently released Preqin Investor Outlook, Alternative Assets, H1 2018 describes the demanding environment for hedge funds. Investors do not believe hedge fund are meeting their expectations, allocations may be smaller, flows may be reduced, and there is a desire for better alignment of interests. Of course, there is also the desire for more performance. To address these issues hedge funds will have to change.

Pension Asset Allocations – Filled With Alternatives And Not Beta (Willis Towers Watson Survey)
The Willis Towers Watson annual survey provides a wealth of information on global pensions and their asset allocations. Pension asset allocations around the world continue to show a move away from the simple equity and bond betas. The current survey shows only 75% of allocations are between equities, bonds, and cash with equities only given an allocation of less than 50%. These allocation numbers, however, show an increasing exposure to global equities and bonds. The other basket, representing the remaining 25%, includes real state and alternatives which can include a wide range of investment products. Pensions continue to move out of equity and bonds for alpha capital appreciation and income. The US equity allocation is down 10% since 2007 (60% to 50%) while the other category is up 10% from 18% to 28% over the same period.
A Financial Shock And Change In The Market Environment – Not Good For Any Investor
There is little protection for investors when there is a price revaluation from a volatility shock. All equities styles declined in February. All equity sectors generated negative returns. Country equity returns were negative and bonds offered no protection. Correlations all moved higher in February although there are some interesting limited opportunities. A comparison of momentum from the prior month and three-month period show the strength of the reversals. Prices fell below short, medium and long-term trends except for few outliers.