Archives

Preqin Investor Survey – What Are The Demands For Hedge Funds?
The recently released Preqin Investor Outlook, Alternative Assets, H1 2018 describes the demanding environment for hedge funds. Investors do not believe hedge fund are meeting their expectations, allocations may be smaller, flows may be reduced, and there is a desire for better alignment of interests. Of course, there is also the desire for more performance. To address these issues hedge funds will have to change.

Pension Asset Allocations – Filled With Alternatives And Not Beta (Willis Towers Watson Survey)
The Willis Towers Watson annual survey provides a wealth of information on global pensions and their asset allocations. Pension asset allocations around the world continue to show a move away from the simple equity and bond betas. The current survey shows only 75% of allocations are between equities, bonds, and cash with equities only given an allocation of less than 50%. These allocation numbers, however, show an increasing exposure to global equities and bonds. The other basket, representing the remaining 25%, includes real state and alternatives which can include a wide range of investment products. Pensions continue to move out of equity and bonds for alpha capital appreciation and income. The US equity allocation is down 10% since 2007 (60% to 50%) while the other category is up 10% from 18% to 28% over the same period.
A Financial Shock And Change In The Market Environment – Not Good For Any Investor
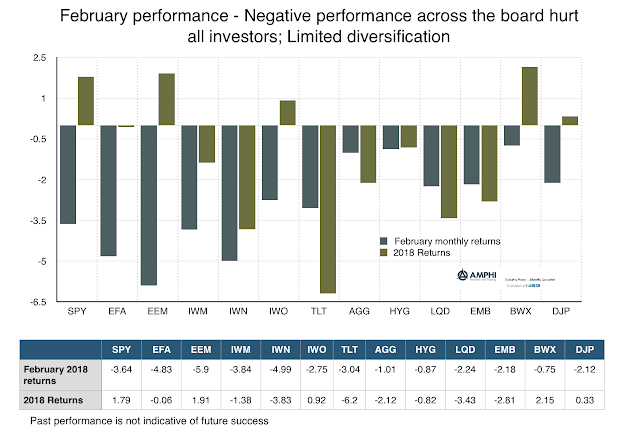
There is little protection for investors when there is a price revaluation from a volatility shock. All equities styles declined in February. All equity sectors generated negative returns. Country equity returns were negative and bonds offered no protection. Correlations all moved higher in February although there are some interesting limited opportunities. A comparison of momentum from the prior month and three-month period show the strength of the reversals. Prices fell below short, medium and long-term trends except for few outliers.
Trends In Markets – Mixed Signals Suggest A Period Of Transition
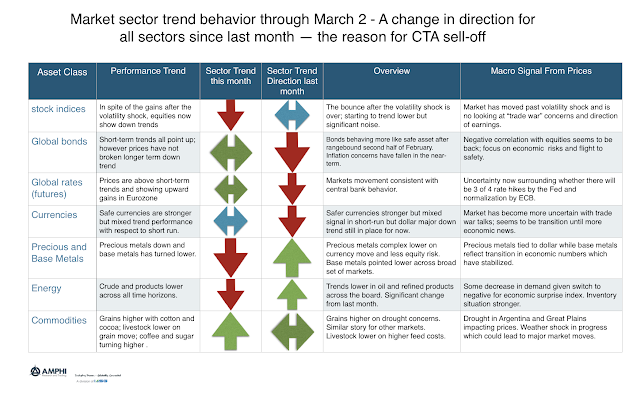
A review of the trends that current exist across market sectors suggest that there is significant noise about directions and fundamental changes from last month. The equity bounce post the volatility shock seems to have played out and now new information such as “trade wars” seems to be defining new trends. Bonds seem to be moving back to the core negative correlation with equities. The dollar sell-off also seems to have paused except for traditional safe asset currencies. Metals are now trending down but commodities are responding to a weather shock. While there may be profitable opportunities later this month, current signals are mixed.
Hedge Fund Performance Sank With Equity Beta Decline
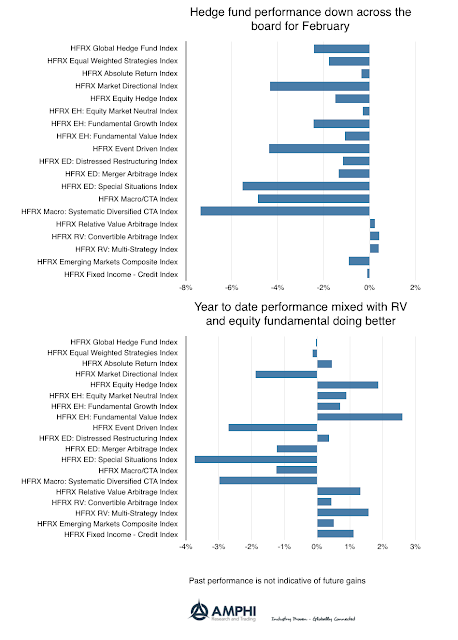
Hedge funds as measured by the HFR indices suffered with the overall market decline with only RV strategies being able to take advantage of the higher volatility environment. In general, the equity hedge fund declines were consistent with their longer-term betas (approximately .3 to .6). The outliers for the month were the event driven, special situations, macro and systematic CTAs indices. The year-to-date returns show significant dispersion with equity hedge fund indices generally positive while special situations, systematic CTAs, and event driven indices falling between -2.50 and -3.75 percent.
Managed Futures Managers Hurt By Volatility Shock
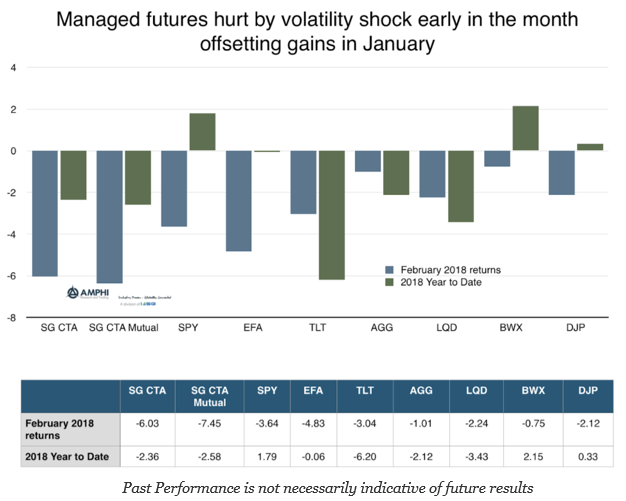
The managed futures hedge fund category generated poor performance in February as measured by the SocGen CTA index and the SocGen CTA mutual fund index. This behavior was also seen in the BTOP 50 index which declined 5.29 percent for the month. The SocGen short-term traders index was down 4.31 for the month but still up for the year by just over 1%. Nevertheless, the year to date return numbers for managed futures are better than long duration bond performance and the credit sector as measured by the TLT and LQD ETFs.
February Performance – Ouch! So Let’s Put In Context
February was a bad month for investment performance. All of the major ETF indices we normally follow were negative. Diversification was an elusive concept and reinforced the key portfolio allocation risks of rising correlation. There is no positive spin with these numbers other than less risky assets like bonds fell less than more risky assets, although year to date numbers show that bonds have not been a safe haven. There are a few takeaways from the month:
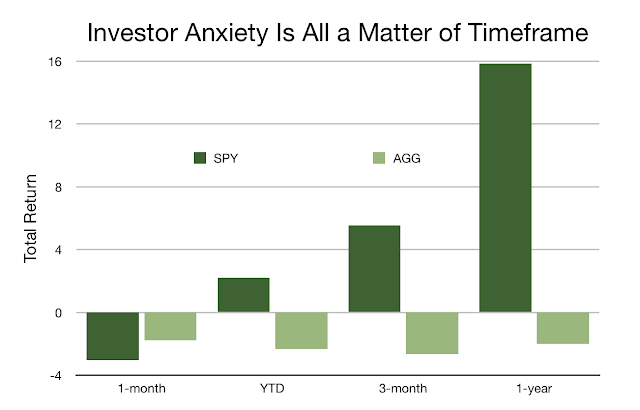
Investor Anxiety Is All a Matter of Timeframe
How would you feel about your investment portfolio if you went to sleep at the beginning of the year and woke-up on Friday? What if you stuck your portfolio in a drawer and pulled it out after three months or a year to look at performance? My guess you would say you were happy and comfortable with your investment decisions, yet there has been a lot of investor anxiety this month.

Financial Shocks Can Be Either Endogenous Or Exogenous – What Can We Expect?
There was a clear financial shock to the market with the spike in the VIX index earlier this month, but the market has reversed a significant portion of the earlier losses. From the SPY high in January, the market declined about 10.5%. There has been a reversal of 6% so the stock market is now positive for the year and only down 4.5% from the high and down 2% from month-end.
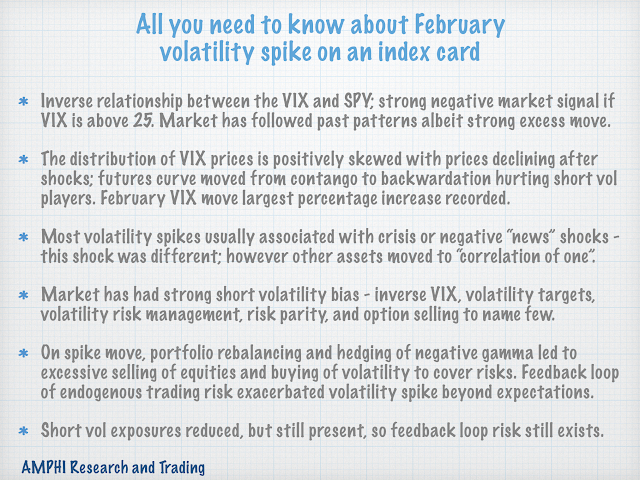
The “3 by 5 Index Card” on What You Need to Know About the February VIX Spike
University of Chicago professor Harold Pollack in an interview a few years ago mentioned that the best money advice can fit on a three-by-five inch index card. He was then challenged to write the card. His financial advice went viral. We follow this tradition by focusing on a simple “three-by-five index card” on the VIX volatility spike earlier the month.

What Is Your Focus? Schwerpunkt – The Center Of Gravity For Your Investment Efforts
Schwerpundt is a German word meaning main focus, center of gravity, or focal point. The term came from Von Clausewitz’s “On War” and refers to the strategic objective or goal of any military campaign or battle. It is the place of greatest importance against an adversary.

Psychopaths Are Not Good Hedge Fund Managers, Neither Are Narcissists – Who Would Have Thought?
Wall Street is filled with characters and “personality”. I have met my share, but a key question is whether some of these personality extremes actually lead to better returns. I have written about this in my posting The Wisdom of Psychopaths and Trading. Some have suggested that the characteristics of psychopaths if directed toward good goals may lead to successful outcomes. The core idea is that a lack of empathy or emotion found in psychopaths is actually good for some jobs. Certainly, there is a strong strain of thinking that trading should be without emotion. Hence, personality characteristics such as less emotion or empathy may be good for return generation. You just may not want to have them as your boss.

Generating Tilts Around Core Bonds – Changing The Correlation, Yield, And Risk Exposures To Bond Sectors Offers Opportunities For Portfolio Refinements
Some may say, “A bond is a bond, is a bond”. Investors may place risky assets in one category and then have bonds in a less risky category. This dichotomy does not focus on the important distinctions between bond groups and the roles that different bond categories may play nor does it present the possible trade-offs between return, risk, and correlation within a portfolio from different bonds.