Archives

Buy the Losers and Sell the Winners? Reverse your Thinking and Be Careful About Avoiding or Exiting Losers
The general view is that an investor should pick good managers who have had a track record of success, but a more nuance look at data suggests that buying when good managers underperform can be valuable. Whether past performance provides some indication on future success has been one of the key issues facing any investor. We now have an interesting perspective from Brad Cornell, Jason Hsu, and David Nanigian in their Journal of Portfolio Management paper, “Does Past Performance Matter in Investment Management Success”.

Buy in a Drawdown? Focus on Future and not the Past Performance
Managed futures, as a hedge fund strategy, have moved off of its max drawdown since June, its worst drawdown in the last five years, as measured by the SocGen CTA index. For some investors this type of drawdown means an exit from the strategy; however, some of the broader data on manager selection suggest a different approach. The idea of being careful about making investment decision based on a drawdown is consistent with the mean reversion performance analysis of winners and losers.

Not Buying the Fed Package – The Fed, Yield Curve, and Bonds
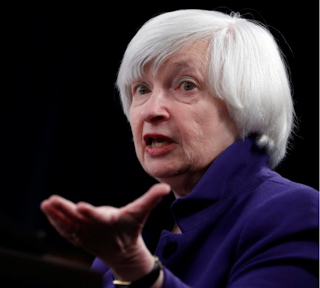
The take-away quote from Yellen this week, “The relationship between the business cycle and the yield curve may have changed.” There was little supporting evidence for her view. It is the hope of the Fed that further rate increases which may further flatten the yield curve will not reverse the current course of the economy.
Factor Risk Premium Differ Across Countries – Make Sure You are Factor Diversified Globally
Equity factor risk premium ranks change through time. The best performing factor premium today may not be the best premium tomorrow even if there are long-term gains across major factors. Most investors would agree with this statement; however, the dispersion of factor performance is more complex.

Commodities Versus Financial Assets – There is Value Here
Equities are overvalued! Bonds are overvalued! In the minds of many investors everything is overvalued given central bank distortions, yet there may be an exception. Look at commodities. The difference between financial and real asset could not be larger. Financial assets have steadily moved higher while commodities have fallen or at best moved sideways relative to risky stocks in the last 5+ years. This relationship has applied to all equity indices around the world to varying degrees.

Rincon Capital – A Rising Tide Lifts All Boats
John F. Kennedy’s aphorism “a rising tide lifts all boats” seems to be particularly appropriate when describing the results of both the domestic and international equity markets these past 30 days.

How Much Machine Learning is Your Quant Using? Not Clear, if you have not Defined Terms
The current buzzword used with quant investing is “machine learning.” Many quants may like to appear more intelligent by peppering their strategy discussions with comments like, “We use machine learning to create new and enhance our existing models.” Yet many investors don’t fully appreciate that machine learning is a term that refers to a broad […]

Producing Alpha Is Not Easy – The Solution to Making Effective Decisions in an Uncertain World has not Been Found
“What I think HBS does and does very well is train people to, in situations of ambiguity, to take imperfect information, uncertain outcomes, and tight deadlines and figure out what to do in the most effective, efficient, and powerful way.” – Casey Gerald from The Golden Passport: Harvard Business School, the Limits of Capitalism, and the Moral Failure of the MBA Elite by Duff McDonald
Corporate bonds and Managed Futures – A Winning Diversification Combination
Managed futures may not generate crisis alpha if there is no crisis, a sustained decline in equities. In addition, managed futures may not provide as strong a cushion diversification effect during normal times since the correlation between equities and managed futures is slightly positive, and there is no managed futures yield. So how can an […]

Financial Conditions – No Signal of Tightening. Trend Says Stay the Course with Risky Assets
The Fed has become more focused on financial market conditions since the Financial Crisis. There is less interest in the classic goal of managing full employment since by many measures we may beyond the natural rate of full employment, and there is admitted confusion on how to control inflation.
Equity Asset Class Value Rotation – Look Outside the US for Upside and Protection
The talk has focused on the overvaluation and “bubble” with US stocks, but there are other relative opportunities in risky equity assets. A comparison of CAPE across the world shows that the UK, euro area, and Japan valuations are closely tied together, significantly below highs from 2008, and all relatively cheap versus US.

“Risk of a Rapid Repricing in Global Markets” – (ECB) With this Narrative, Investors Need Strategies that Generate Portfolio Gamma
“Risk of a rapid repricing in global markets”; this ECB quote was a key talking point in the press release from the ECB Financial Stability Report issued last week. Note that “rapid repricing” is a polite way of saying asset price declines.
Hedge Fund Performance Mixed, but some Bright Spots with Fundamental Growth and Systematic Macro
Hedge funds returns were mixed for November, but the fundamental growth and systematic macro strategies generated strong returns of over 1 percent. The fundamental growth strategy is the HFR leader for the year with a return profile at over 17%. The macro systematic strategy again generated a strong positive return. The HFR macro systematic index return was significantly higher than other systematic indices for November which suggest a high dispersion across managers in this category. The macro/ CTA which includes discretionary managers was actually down for the month. The absolute return, special situations, and emerging markets strategies were the biggest down strategies for the month, but all showed declines of less than one percent.