Archives

Thoughts of Managed Futures Death Were Premature
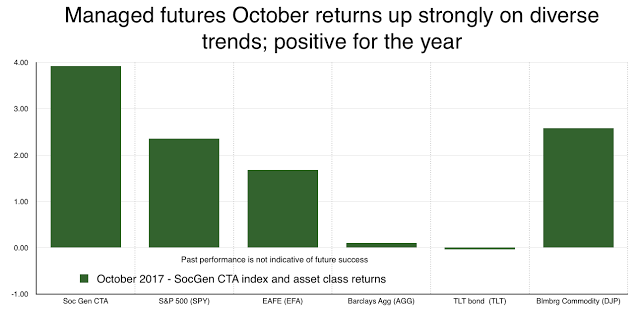
Managed futures returns exploded to the upside with index returns showing big gains relative to alternative asset classes. The positive skew for some managers was even more surprising. We saw some October returns as large as 14%. Every major index we track was close to 3% or higher. For example, the October return using the Morningstar managed futures category was positive 3.45 and the year to date return was up 1.85 percent.

Natural Gas Market – Elasticities Are Changing and That Means More Volatility
Natural gas has always been a volatile market and subject to weather shocks; however, over the last few years the volatility and weather shocks have been dampened because of the high storage inventory levels. Monthly volatility has declined by at least 1/3 over the last three years as inventories remained high.

Risky Assets Up and Safe Assets Flat – Investors Look Beyond Any Political Rhetoric
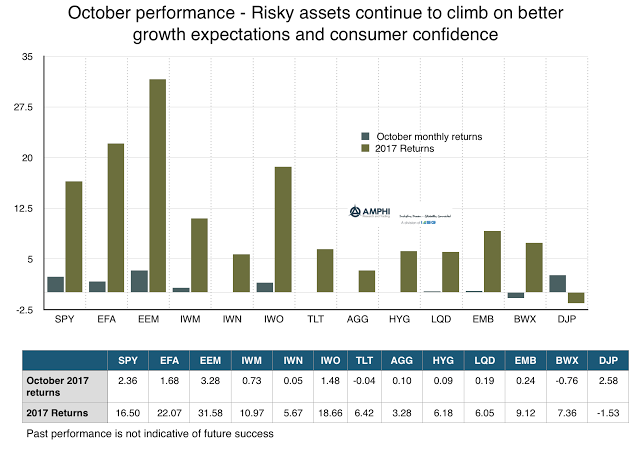
Talk of tax cuts floating through the halls of Congress coupled with stronger consumer confidence allowed risky assets to continue marching higher. Warnings of overvalued equities, concerns over leverage, and higher geopolitical risks, have not stopped stocks from stronger gains around the globe. For US companies in the third quarter, 76% have shown positive earnings surprises and 67% have had positive sales surprises. The earnings growth rate is 4.7% for the third quarter according to Factset. Positive economics, good company performance, and low volatility all contributed to this continued rally.

Get To Know the Types of Diversification Because it Matters for Long-Term Performance
A simple explanation for looking at a portfolio as a bundle of diversifiable risks is presented nicely in the new book, Rational Investing; The subtleties of asset management by Hugues Langlois and Jacques Lussier, two excellent researchers and money managers.

Interest Rates for the Ages – “Winter is Coming” for Bonds But It Can Take a Number of Forms
The Bank of England research piece, Eight centuries of the risk-free rate: bond market reversals from the Venetians to the ‘VaR shock’ by Paul Schmelzing, is important reading for any investor. It places the current bond rally which has been going on for over three decades in the long term context of the last 700 years. This bond bull movement is exceptional but not yet extraordinary when look at through history. Unfortunately, all bond rallies will end, but the reasons for ending may vary.
Col. Jessup, Managed Futures, and Code Red for Liquidity
As we approach year-end, it is a good time to think about liquidity and exit strategies from current allocations. Many alternative investments are just not liquid when you need it, even if it is a daily fund. Of course, there is a price or cost with liquidity. Investors may exit but at onerous levels; however, those alternatives that focus trading on liquid instruments will have an advantage over complex strategies or funds that focus on asset that have lower liquidity to start with. Searching for liquidity in a market downturn is a losing game.

VaR – Good for a Manager, But Bad for the Markets as a Whole – Call it the “Paradox of VaR Risk Management”
So if there’s a big market sell-off and as a response the VaR overreacts and shoots up, then many investors are kind of forced to sell because they have to stay within their VaR limits and this selling will then be done in an already collapsing market…rigorous use of VaR measures undermines the stability of markets.
It’s the type of risk management practice that works well as long as it is not needed; just like Bernanke observed after the credit crisis about their standard models that proved to be “successful for non-crisis periods”.
-Harold de Boer Transtrend
Opalesque Roundtable series ’17 Netherlands
Risk Parity With Strong Performance, Yet Global Macro – Managed Futures May Be a Better Choice to Offset Mispricing Risk
The positive performance of risk parity products has been sneaking up on clients after poor returns in 2015. This long-only product have done much better than many other multi-asset hedge fund strategies in the last year with the HFR 12% vol institutional index being up 9.46% through September; however, it has been riding the wave of asset price mispricing or overvaluation.

Formal or Informal Predictive Procedures – If it is Repetitive, Go with the Formal Approach
The human brain is an inefficient device for noticing, selecting, categorizing, recording, retaining, and manipulating information for inferential purpose.- W.M. Grove and P.E. Meehl
If those are all the things that the human brain is inefficient with, what is left over? A lot, but there has to be focus on using the brain for the right problems and when to change the thinking process.

Curiosity – There Is More Than One Type and Hedge Fund Managers Need Them All
What makes a good investment manager? One trait not often talked about is curiosity. You cannot find new or unique opportunities if you are not curious; however, the concept or meaning of curiosity for investment management may be hard to define.

Understanding Investor Preferences Is Not Easy – Just Ask Them
The line between recent “exotic preferences” and “behavioral finance” is so blurred that it describes academic politics better than anything substantive. – John Cochrane University of Chicago
John Cochrane, as well as others in finance, has focused on the academic issue of defining preferences for investors at an abstract level, but the issue becomes a reality when trying to extract preferences from investors to help build a portfolios.
Time Series or Cross Sectional Momentum – Which is Better? Your Choice May Matter
The marketplace is abuzz with the value of momentum trading, but a closer inspection shows that it is packaged in two major strains, time series and cross-sectional momentum. The traditional trend-following CTA focuses on time series momentum while the most of the equity research and implementation is conducted through the cross-sectional approach. There is similarity between these approaches, but there are also enough differences so that the return profile for each will not be the same.

If You Take Away the Fed Balance Sheet, Should the Bond Premium Be Negative? Term Premium Reality
The Wall Street talk is that all markets are over-valued, yet any valuation has to be placed in context. For fixed income, this is not easy given you have to make a judgment on both the real rate of return and expected inflation. Additionally, there is a need to measure the term premium associated with bonds. The premium measures the compensation necessary for investors to hold longer duration bonds versus a series of successive short bonds given the volatility and uncertainty associated with real rates and inflation. The term premium is not directly observable and is difficult to measure but has intuitive appeal.