Archives

Central Bank Communication and the “Cool Hand Luke” Effect
” What we’ve got here is failure to communicate. Some men you just can’t reach. So you get what we had here last week, which is the way he wants it. . . well, he gets it. I don’t like it any more than you men.” – Cool Hand Luke (1967) – The Captain’s speech
The last week was tough on both bond and equity markets around the globe because central bankers were trying to provide “forward guidance” to the market. Central bankers speak and the market will listen and react.
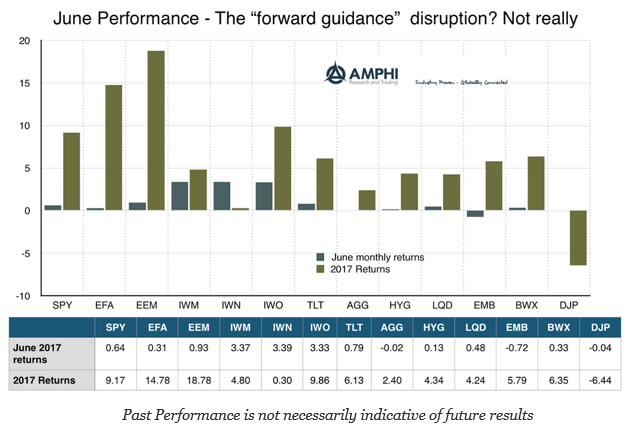
End of Month Disruption Did Not Offset Gains for Month – The Upward Path on Holiday
In spite of the market anxiety during the last week of the month, most major indices generated positive returns for June. The only exceptions were the emerging market bond index (EMB), the Bloomberg commodities index (DJP) and the Barclays Aggregate index (AGG). It was surprising that small cap, value and growth all posted strong gains after falling behind global and large cap equities. Bonds were generally positive even with the turbulence in the last week.

Diversification without Some Pain is not Diversification
“No one likes losing money, but if something in your portfolio isn’t giving you heartburn, you’re probably not diversified.” – John Lindner, PCA Consulting
How many times have you recently heard, “My hedge funds are not generating enough performance relative to my equity portfolio. Why am I holding this stuff?”
The answer is simple. It provides diversification. This diversification can be across markets, time-frames, factor sensitivities, and styles of return generation. Diversification by its very nature means that there will be performance differences and return gaps. A well-diversified portfolio will have assets that do not move together, so it should not be surprising that if an asset is added to generate diversification it will not match the core performance of equities and bonds. If performance across portfolio exposures is similar, diversification was not achieved.

A Way to make Money in Commodities – Good Portfolio Construction, Momentum, and Carry
It has been a tough period for making money in commodities especially if you have been a long-only index investor. When the super-cycle turns down, there is no place to hide even trading from the short-side has been challenging. Both momentum and carry-based approaches for finding opportunities have suffered during this period of prolonged decline; […]

Position Sizing, Expected Return, and Portfolio Results – There is Imprecision in Trader Language
This is where simple cases of imprecise language can lead to confusion. Investors may have problems with understanding what a trader means if all the assumptions concerning trading are not well-defined. Here are some questions that an investor may have when hearing the above phrases.

Mixing Collateral with a Managed Futures Portfolio – Need to Know Marginal Contributions
In an earlier post we discussed the issue of using capital more efficiently in a managed futures investment. The premise is simple. If only limited funds are used for margin, the majority of cash associated with a managed futures investment are held in low interest investments. This portion of the managed futures capital can be better deployed to increase returns. Similarly, managed futures can be used as an overlay to an existing portfolio to better use cash. See “Use your collateral wisely and enhance managed futures efficiency”.

Northern Trust – EIU Survey – “See” the Risk – “Know” the Risk
The Northern Trust/EIU Transparency in Alternatives Investing Survey 2017 focuses on some important investment considerations from investors around the world. Once again the most important issue seems to be the degree of transparency provided by managers. This applies to both traditional and alternative managers. An investor needs to know what he is buying when he gives money to a manager. Funds are entrusted to others. The purpose for this transparency is very clear – understanding the degree of risk being taken.

Use your Collateral Wisely and Enhance Managed Futures Efficiency
Managed futures investments have the key structural feature that they do not use leverage in the sense of borrowing money to increase notional positions relative to cash. In most cases, margin requirements are a small fraction of the capital invested in a program or fund. A managed futures fund may only use less than 20 cents on the dollar for margin while 80 cents or more may be held in a custody account at close to zero interest rate. Nevertheless, some managers are more aggressive and may hold funds in an enhanced money fund or short-term bond fund to add to return. Of course, some investor will use a separate account and only provide funds for margin with a cushion. This cuts the excess cash held by the manager.
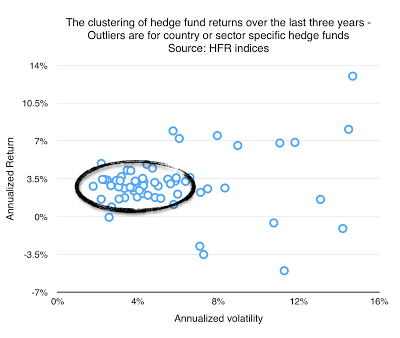
Clustering of Hedge Fund Returns – Where is the Difference?
A close look at all of the HFR hedge fund index returns over the last three years shows a significant amount of clustering of styles with the only outliers associated with country and sector indices. For 60 indices, the average three year (May 2014 – May 2017) annualized return was 3.04 percent and the average annualized volatility was 5.61 percent. Outliers are focused on sector indices like technology and energy and country or regional indices like India or Latin America.
Smart Beta – Why Look at these Investments? Diversification
The FTSE Russell annual survey on smart beta does a good job at describing trends in investor thinking with respect to this growing area of portfolio allocation. Smart beta is extending its breath and reach to other asset classes as well as a wider selection of risk premiums and formats. What is still clear is that investors are looking for smart beta in all forms to help with risk reduction and improve diversification. These are the number one and three reasons for holding exposures. Nevertheless, the fastest growing investment objective is cost savings. It is likely that smart beta is being used as a substitute for more expensive active management.

Can Momentum and Diversifications Solve Every Investment Problem?
I listened to a number of presentations concerning crisis alpha and crisis offset at a recent hedge fund conference. The idea of holding assets and strategies that will do well in “bad times” is a critical issue for any portfolio construction discussion. It is the bedrock and foundation of any portfolio that attempts to protect against bad states of nature, control risk, and gain during good times.

Two Components of Active Management, Style and Skill – Investors Need to Choose both Wisely
There has been much discussion about benchmarks and beta with hedge funds, but it is important to take a step-back and discuss how active returns are generated. Active management can be divided into two parts, the style used and the skill employed within that style. You can call a style a risk premium as is the case for value or small investing; however, all returns from styles may not be from risk premiums. Style is simply a descriptor or means for generating returns. Skill comes with the method of employing the style. Within a style, some managers are better at it than others.

Quants vs. Discretionary – Numbers vs. Story – Is One Better?
Most of our quants have a computer-science background. They can code in either Python or C++. Whereas on the discretionary side most of them come from a more traditional investment-banking background and are digging into 8-Ks and company fundamentals and being able to look at companies from a bottom-up perspective as compared to trying to use many different data sets to help predict the prices of stocks.
-Ryan Tolkin CIO Schonfeld Strategic Advisors
As the old joke says, “There are only two types of people – those that type others and those who do not.” However, this dichotomy may be applicable for current money management. There are two camps of analysis, the quants who are looking for repeatable behavior in data and the discretionary analysts who are looking for unique or special situations across markets. The quant plays the averages and the probabilities while the other places value on what cannot be counted and handicapped. One focuses on the numbers while the other looks for the firm story as a thesis for investing.