Archives

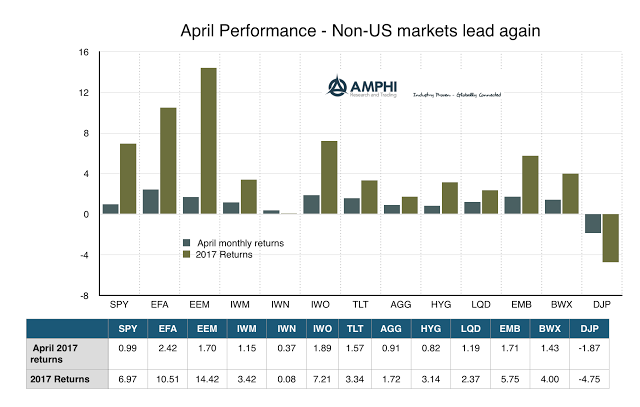
Strong Gains around the Globe for Risky Assets
It is a risk-on world with global equities (EFA) and emerging markets (EEM) now posting double digit gains for the year. A first round French election that was pointed less in the direction of Le Pen and a Trump presidency that does not seem as extreme as some pundits suggested has been coupled with global economic growth that is stronger than expected. The deflation trade may be further tempered in the US, but the threat of trade wars has diminished and the world economy is more focused on reality than dire economic scenarios.

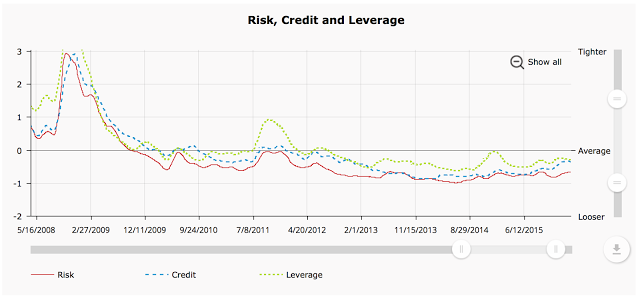
Always Check the Financial Conditions – Still Loose
There are many narratives for why equities or bonds will move higher, but a recurring theme is the financial conditions faced by investors. Financial conditions provide the tailwinds or headwinds to push asset class returns. These conditions tell us something about whether we will be transitioning between a risk-on and risk-off environment or whether we will be a crisis mode.
The Real Bias – Stock Optimists versus Bond Pessimists
During a simple discussion on investing, the topic turned to biases. We have learned to talk about many biases from behavioral economics. We now have a catalog of preferences which makes them easier to mitigate. Still, there seems to be one bias that is very hard to address, and that is the overarching theme of […]

Determine What Goes Wrong with Your Investment Model
How do you know whether a model is broken? Or, how do you conduct a model review? There are many specific steps for any review but there are four major questions that have to be addressed that are separate from risk management. The key question of model efficacy should focus on forecasting skill and action. Does the model forecast correctly and is the model employed properly to make good decisions.
Preparing for Market Risk – Stay Diversified Across Asset Classes, Factors, and Strategies
You get recessions, you have stock market declines. If you don’t understand that’s going to happen, then you’re not ready – you won’t do well in the markets. If you go to Minnesota in January, you should know that it’s gonna be cold. You don’t panic when the thermometer falls below zero.
-Peter Lynch

Follow the World Business Cycle – Economies are Integrated
Globalization is a critical part of macro investing. There can be talk of separation politics, but for investors, you have to focus on the global economic cycle because the world is highly integrated. What is very interesting is that globalization has been fairly stable between the current environment and the Bretton Woods period as discussed by the recent work of Eric Monnet and Damien Puy who studied long horizon data available from the IMF. They find that there were two common shock periods which caused a highly synchronous global behavior. The first was oil shock period of the 70’s and the second was the Great Financial Crisis. You could say that these were the two periods when “correlations went to one” across asset classes. There was no international diversification benefit.

“Winner‐Take‐All” Dynamics and Hedge Fund Investing
A growing stream of thinking in microeconomics is the concept of “winner-take-all” dynamics. The idea seems simple. A combination of networking economics and classic economies of scale creates situations where there are just a few dominant firms or economic agents who are able to capture significant market share in a given industry. With the advances in technology over the last decade, many industries are seeing the impact of winner-take-all dynamics leading to the result of greater concentration.
Populism and the Market: Assessing Risks for Investors
There has been tremendous talk concerning populism and politics, but for investors, the focus still must be on these movements’ economic and market impact. So discount the news headline and rhetoric and focus on the potential market impact, but a good definition of populism is necessary for building a framework to determine risks. Defining Populism […]
The Role of Factors in Finance: A Focus on Global Macro Investing
What has been at the vanguard of thinking in finance is the breakdown of returns into their constituent parts or risk factors. Finance has moved well beyond market beta. The first breakdown for a portfolio is not returns by asset class but returns by risk factors. Some have criticized the current situation as a factor […]
Why a Buy-and-Hold Strategy in Commodity Index Investing May Not Work
An article in the Wall Street Journal, “Why Commodity-Index Investing May be Futile,” has attracted much interest from investors. However, there was no new information in the story. The reasons for avoiding commodity indices should be taken seriously; nevertheless, the broader issue of differences between commodity and equity investing is straightforward. Commodity investing in an […]
Using Economic Growth as a Predictor for Managed Futures Returns
Another simple test to determine whether managed futures returns will do better than average is by looking at economic growth. We know that bonds and other defensive assets like managed futures will do better in “bad times,” such as a recession, but there are not many recessions. The cost of being defensive can be very […]

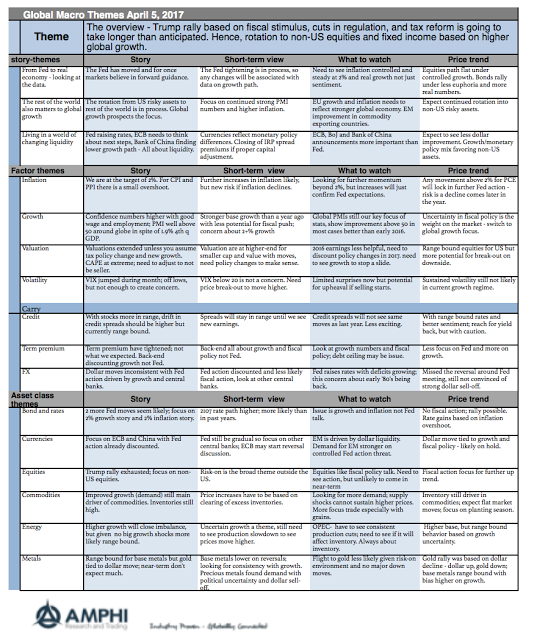
Global Macro in One Page – Rotation to Non-Dollar Assets Continuing
March was a tough month for making any economic judgments. The Trump rally in equities was expected to continue, but reality has been a switch to non-US risky assets. A bond sell-off was expected given Fed action combined with more fiscal policy revelations. It did not happen. The dollar was expected to continue its rally based on further confirmation of the Fed being out of step with other central banks. It did not happen.

March Showed a Rotation in Return Performance
March saw a significant rotation in return performance from US equities to global and emerging markets and from value to growth. Our indicators show prices are starting to break to the downside albeit trends are currently flat. March was a transition month from euphoria to reality concerning US government policies. Future price direction will be determined by the real economy and not policy expectations.