Archives

Bubbles Are Everywhere if You Know How to Look for Them
Markets have been known to move to price extreme which have often been referred to as bubbles. The best know of these bubbles have been noted to lead to large market dislocations in both financial markets and the real economy. The “dot com” and housing bubble are the best known most recent examples, but unfortunately, there has not been much agreement on what are identifiable characteristics or the cause of these bubbles. While there can be agreement that bubbles are related to positive feedback loops, there is little work on a method for filtering data through some general model that will define a bubble.

Preqin Survey – Investors Frustrated with Performance
Hedge funds are frustrated, as evidenced by the recently published Preqin Investor Interviews. If hedge funds do not perform this year, there will be significant changes in allocations. The number of respondents to the survey who said that returns fell below expectations increased by 50% in one year to the highest levels reported. Only 3% of investors believed that returns exceeded expectations. This was tied for the lowest levels reported.

Preqin Survey – Lower Allocations to Macro and Managed Futures
A close look at the investor intentions for hedge funds suggests that poor managers will see their allocations reduced this year. The proportion of respondents who will reduce their allocations is at the highest levels reported and about 20% higher than last year and more than double from two years ago. Similarly, the survey has lowest level of respondents willing to increase their allocations.
The Impact of Innovation on Commodity Price Forecasting
Forecasting is difficult for any financial asset but can be especially difficult for commodities. The peculiarities of futures, the potential for large supply shocks, and the higher volatility are associated with the varied interaction of hedgers and speculators. Still, there is also something that makes medium-term forecasts especially difficult – innovation. Innovation and technical change […]

The Willis Towers Watson Global Pension Assets Study 2017
The Willis Towers Watson Global Pension Assets Study 2017 shows that the same pension trends for the last decade continue. First, the march to defined contribution (DC) plans from defined contribution (DB) plans has not abated. Of course, there are some wide variations across countries, but the good old days of getting a managed pension from a company or a state are not coming back. Second, the growth in pension assets from the major countries is slowing but continues to rise in emerging markets. Emerging markets do not have the same developed pension systems and often have pension assets well below the country GDP. There is a catch-up in EM and this is where asset growth will be seen.

It Is All About the Volatility Management
For many investment strategies, the difference between a good and a bad manager is based on their ability to manage risk. It is as much about how volatility is handled as return generation. A good strategy that does not manage risk well will never be successful. A key conclusion from a recent paper that focuses […]

News Sentiment – It is Worth Following
Some may feel they are overloaded with news and it is just noise. Well, some new machine learning research suggests that following new is worth a second look. The news can provide a strong measure of sentiment that can improve forecasts versus using traditional fundamental information. This news sentiment is also unique and can add value versus survey sentiment information found in the long-serving Conference Board and University of Michigan work. This new research on sentiment is presented in the paper, “Measuring News Sentiment” from the Federal Reserve Bank of San Francisco.

Equity and Bond Volatility are Different – The Need for Broader Thinking
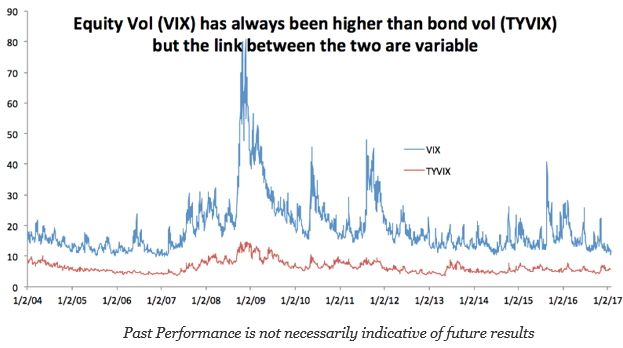
A key issue with asset allocation and risk parity is the changes in volatility across asset classes. The foundation for risk parity is based on equal weighing of asset classes volatility as opposed to setting dollar weighting. Hence, knowing the relative differences in volatility and how they move through time is critical. We can describe some of the key issues associated with any volatility matching or equalization strategy by taking at a quick look at the CBOE VIX index for equity volatility and the TYVIX for Treasury bond volatility. The simple case of comparing these two major assets classes helps to describe the problem of volatility matching.

Bond and Equity Flows -Who is Underwater?
Asset allocation changes are often associated with the pain faced by investors. When there is financial pain through loses, allocations change, so it is important to know where are the pain points. Pain points can be associated with book value loses. Look at when money flowed into an asset class and the price associated with that flow.

BlackRock Survey – Investors Will Pour Into Real Assets
Earlier this month, BlackRock reported their institutional investor survey findings taken from late last year. The results are not that surprising if you believe that inflation may be rising and there is still a need for yield. Cash levels are expected to decline along with fixed income, but real estate will see a large boost. Investors will reduce public equity exposure, but increase their exposure to private equity. There is a bias to less liquid higher risky assets. What may catch some by surprise is the large increase in allocations to real assets which includes timber, commodities, infrastructure, and farmland.

Contango Still Dominates the Commodity Markets
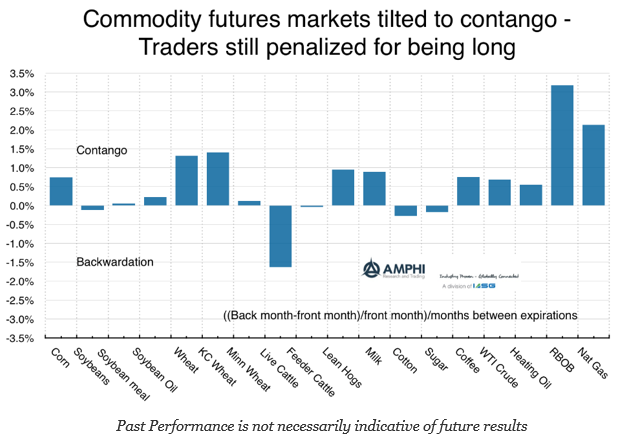
There has been increased interest in commodities and real assets with the increase in inflation. Commodity price as measured by the Bloomberg commodity are off the lows since February of last year, but he markets are still digesting the adjustments in demand and supply since the Great Financial Crisis. Most markets are still in contango because of high inventory levels. These contango levels have fallen over the last year, but are not like the long periods of backwardation during the 90’s and commodity super cycle. This places a significant roll drag on performance for pension funds that may choose to buy an index.

Endowment Models – Bogle Simplicity a Winner
Everyone likes to follow what endowments are doing because there is the assumption that they represent smart money. If universities are where the smart people are, then it stands to reason that their money managers are also smart. The return numbers suggest that endowments don’t have a lock on good performance. In fact, simple allocations have proven to be more effective at generating return. The Bogle model which is a simple variation on the classic 60/40 stock/bond mix is a perfect example. This asset allocation in made up of 40% US equities (total US stock index), 20% international equities (total international stock index) and 40% bonds (total bond index). The Bogle allocation works when compared with endowment allocation which have been tilted to alternatives and away from equities.

Inflation Closing in on Magic 2% or Bouncing Back
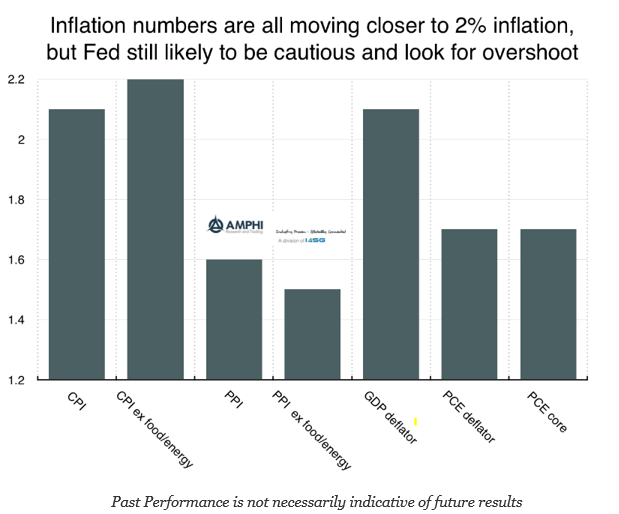
Current inflation numbers are all moving closer to 2%, but there is no special policy action from hitting or exceeding this rate. In fact, a cautious Fed is more likely with the most aggressive forecast being 2-3 rate moves. The Fed has not followed a mechanistic policy even though they have stated they are “data driven”. The most likely forecast will be to fade the earlier musings of the Fed.