Archives
Kottke Commodities – U.S. Crops, World Demand Both Probable Records
July is the make-or-break month for U.S. corn, as well as immediately ahead of the counterpart period for soybeans. After burgeoning world demand stripped the big South American soybean crop bare in only five months, and Brazil’s corn production shrank, the consequences of a merely modest problem in the U.S. harvest would have been extremely serious. Widespread publicity of “La Nina,” an unusual eastward shift of warm water in the Pacific Ocean associated with poor growing conditions inNorth America, had the world food market particularly on edge. Prices of both corn and soybeans rose sharply in June in apprehension of widely-forecast hot and dry weather during the crucial months to come.

Looking for a Turn in Both Government Bonds and the Japanese Yen
In quite a few ways, recent weeks have been anything but boring. Trying to filter out important events from random noise in markets today feels like a bit of a mugs game, but that shouldn’t stop us from trying if we think that we can add some value to our investors. We would like to pick up on a couple of areas that are gaining our attention, and we’re certainly not alone, so here goes with our version of events.
Managed Futures Prospers from BREXIT Blues
The IASG Trend-Following Strategy Index posted an estimated net return of +4.59% for June. The dominant theme in June was the UK referendum on EU membership, or ‘Brexit’ and the attendant surge in volatility that resulted in positive performance for CTAs. Trading conditions for systematic diversified managers were conducive due in large part to an […]
Kottke Commodities – Soybean-Corn Supply Imbalance to Continue
The world grain trade has been shocked in 2016 by the speed with which the entire exportable surplus from a large Brazilian soybean crop was consumed. While statisticians’ opinions differ, the more astute extrapolated early on from the pace of vessel loading that importers would not only come with equal alacrity for the U.S. crop next fall, they’d even need to tap more U.S. supplies yet this crop year. In short, demand for soy meal, a high-quality, high-protein feed ingredient key in efficient meat production, is beyond anything anticipated.

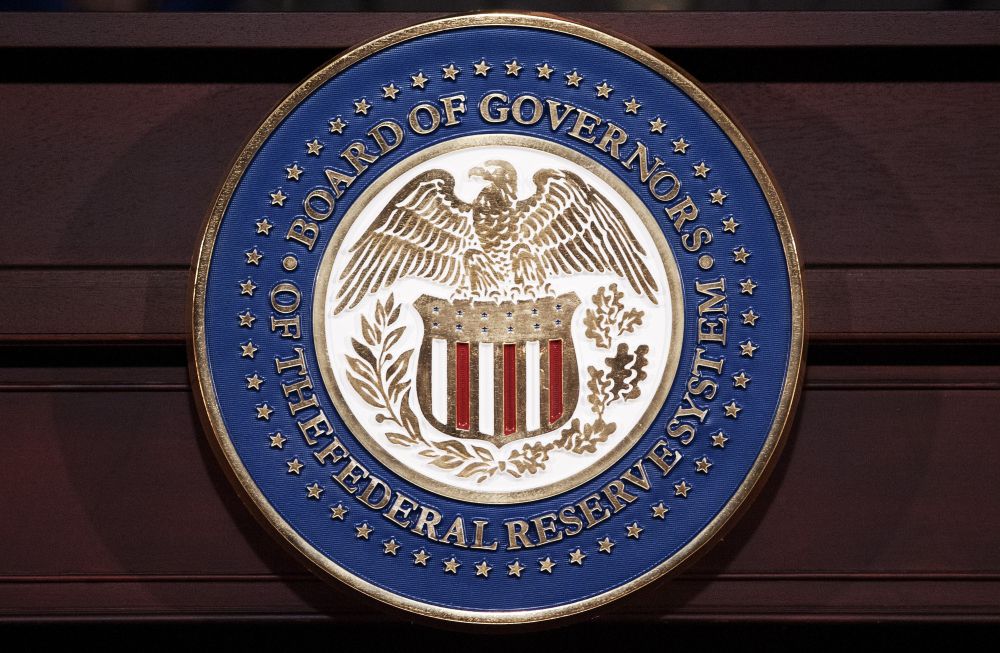
The Failures of Central Banking
We have been meaning to write an in depth report on central bank policies for some time and the market responses to recent BoJ policy decisions as well as the Fed meeting and press conference this week have nudged us to make a start. Below are some initial thoughts on how good central banks are in their forecasts and where they may take us in the future. We don’t mean this to be a rant, but it’s hard to discuss central banking politely when they have been so ineffective, when they refuse to accept they have been incorrect and they refuse to fully acknowledge the full unintended consequences of their hugely experimental policies.

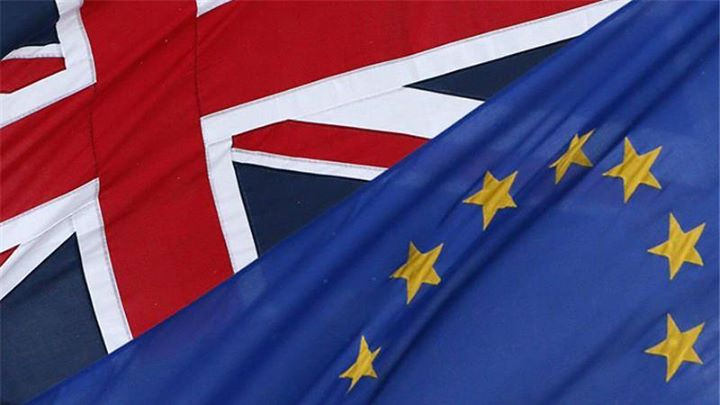
Another European Summer of Discontent
The most obvious and immediate European problem is the UK’s Brexit vote on 23rd June, and momentum has clearly swung away from the remain camp in the last two weeks. What was seen as only a minor risk for financial markets has quickly become a huge potential risk and prices have begun to adjust. In our opinion, this is not just an issue of migration but a problem of the average man on the street simply does not feel that their lives have improved materially since the Global Financial Crisis. There are a huge number of voters who feel completely disaffected and simply want change. This is not an issue unique to the UK. Huge numbers across Europe and the US are in the same boat and the risk of a series of anti-establishment votes in the next year or so is growing.
Life Just Became a Lot More Difficult for the Data Dependent Fed
After a truly disappointing US employment report, the market has priced out any rate hike in coming months, with only slightly more than a 50% probability of one rate rise by year end. In our opinion, Janet Yellen has always been a lot more dovish than a number of her colleagues and will not want to raise rates now. So, either the Fed ignores the poor US employment report (and the continuing weakness in the manufacturing sector and corporate profitability) and raise rates anyway, thereby risking upsetting the financial markets. Or, they shift back to a more dovish narrative, risking their credibility.
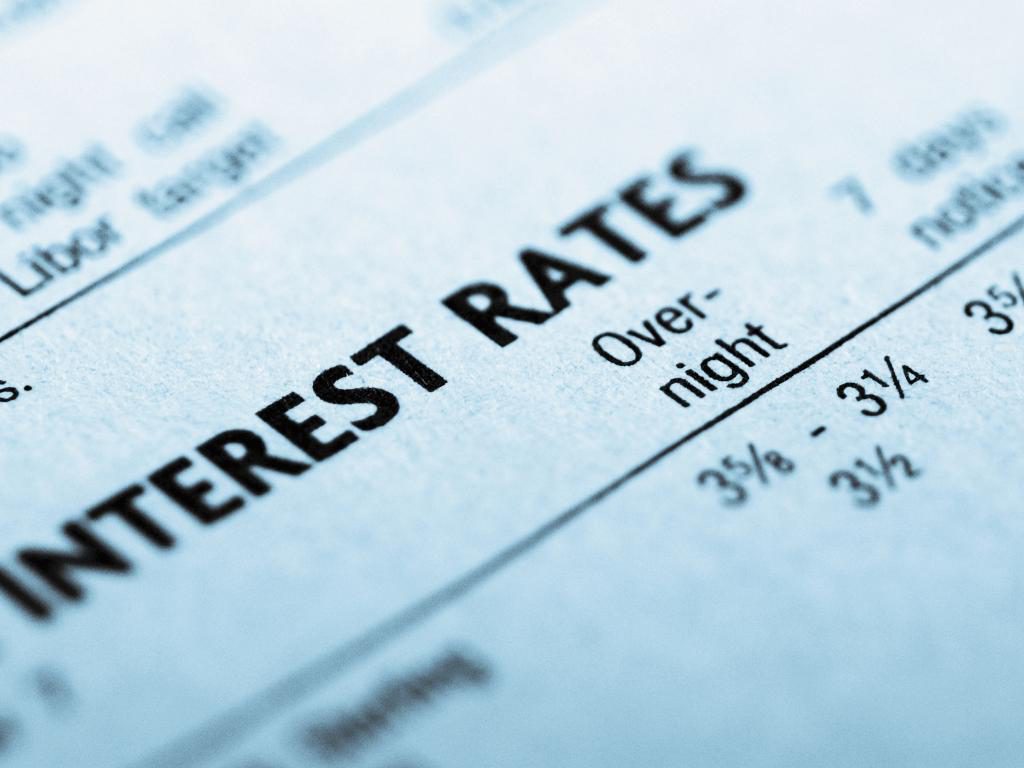
When Interest Rates Rise From Zero
The general rule of thumb in equity investing is that you do not Fight the Fed, and there is a lot to be said for that thesis. Naturally, one has to respect the idea that higher rates provide more competition for equities in the traditional equity/bond portfolio, and vice versa when rates are low. I have actually spent, who knows how many, hours trying to model equities vs interest rates and I learned several lessons in the process. Primarily that rates high and rising are indeed not conducive to higher equity prices. However, rates low and rising are not as reliably equity unfriendly. And one can make a case that rates Low and rising are initially actually very good for equities. My studies suggested a high correlation between equities and rates when rates were high, not as much when rates were low.
Markets Have to Adjust as Fed Alters Course
The Fed’s normalisation process has been a tortuous on/off affair primarily because their focus has been almost entirely on not upsetting the financial markets rather than doing the right thing for the long term health of the US economy. This week, the Federal Reserve machine cranked into action to persuade markets that they want to raise rates before the Summer and again before year end. So far, the reaction has been quite muted, but it is far from certain that this calm veneer will continue. Let’s dive in and think about what the Fed are doing and what this means for markets.

大宗商品交易顾问基金研讨会
拓展海外资产投资,深入了解大宗商品基金策略与投资 时间: 2016年8月20号-至29号 地点:芝加哥 主办单位: Institutional Advisory Services Group, USA
Investors in Search of Instant Gratification But Patience Needed
As most of us know, trying to predict financial markets is frustrating nearly all of the time, and downright impossible too much of the time. Part of the problem is that everyone wants instant gratification. As money managers, we are delighted when our trades become immediately profitable and frustrated when they don’t. The same goes for all market participants regardless of individual timeframes.
Kottke Commodities – A Half-Empty or Half-Full Glass?
We know of very few commercial entities or traders that were positioned last month to reflect much possibility that soybean prices at CME might be far too low. Plenty of different explanations have been offered as to the source of last month’s abrupt price explosion of grains and oilseeds prices. These can be roughly divided into two groups, “game theorists” and “statistical analysts.”
IASG Launches Broker Dealer to Serve an Expanding Audience for Managed Futures
IASG Alternatives was founded in 2015 by current IASG team members Perry Jonkheer, JonPaul Jonkheer, and portfolio managers, Tyler Resch and Greg Taunt. This new company adds to the services provided by Institutional Advisory Services Group (IASG) by offering futures fund and managed account platform products designed to fit the risk tolerance, diversification, and transparency needs of our customers. Our free portfolio review process consists of an initial consultation, research and evaluation of managers that fit prospective customer’s risk return profile, portfolio design, and ultimately daily monitoring and reporting once an investment is open. Through education and proper manager selection we believe futures are an option that everyone should be knowledgeable about as a potential diversifier for their traditional investments.